A Bridge on Economic Issues between China and the World


 Facebook
  Twitter
  Instagram
 WeChat
  Email
Email What Is Special about China’s Housing Boom?

The spectacular ongoing housing boom in China has generated great concerns around the world about the risk of a housing bust on the Chinese economy and the world economy. This column by four Harvard economists compares this housing boom with that experienced by the U.S. in 2000s and dissects its distinct characteristics — its fundamental support, enormous construction, and the delicate role played by government policies.
The Chinese housing boom is one of the most extreme economic events of the new millennium. Price indices produced by Fang et al. (2015) show that prices almost quadrupled in China’s largest and wealthier Tier 1 cities between 2003 and 2013. Prices in Tier 2 cities tripled. By contrast, during the U.S. boom that led to the financial crisis, real housing prices increased by 50 percent between the third quarter of 1996 and the third quarter of 2006, according to the Federal Housing Finance Agency Repeat Sales Index. As Figure 1 below shows, the U.S. boom pales by comparison with the one in China.
Figure 1: Price Growth by Tier: China and the U.S.
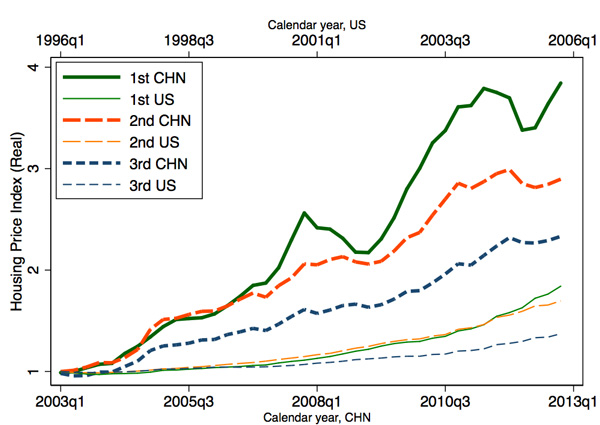 Note: Housing price index data for China are from Fang et al. (2015). Housing price index data for MSAs in the U.S. are from the Federal Housing Finance Agency. We construct tiers in the U.S. by ranking U.S. MSAs based on 1990 income per capita and assign tiers so that each tier has the same population share as that of China. The richest MSAs are assigned to Tier 1 cities and so on. We calculate a real price index using a nominal price index adjusted for inflation. Price indices in each tier are weighted averages of city level price indices.
 The difference in the volume of completed construction between the U.S. and Chinese booms is equally dramatic, as Figure 2 shows. At the start of the U.S. boom in 1996, American home builders were constructing about three billion square feet per year according to the Census of New Construction. By 2006, that figure increased to somewhat over four billion square feet per year. According to China’s Statistical Yearbook, Chinese annual construction was six billion square feet in 2003 and rose to almost twelve billion square feet in 2013. The gap between the two countries is partially explained by China’s vastly larger population, but it is still remarkable given the large disparities in wealth between the U.S. and China over this time period.
Figure 2: Construction (Square Footage) China and the U.S.
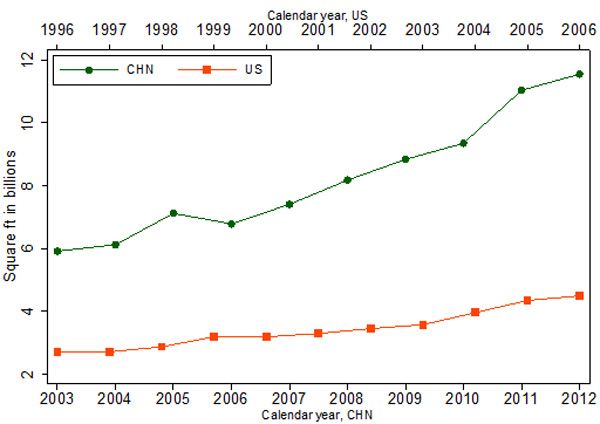
Note: The annual completed residential space for China is from the China Statistical Yearbook. The annual completed residential space for the U.S. is calculated as units of single family homes completed multiplied by average square footage of new single family homes combined with units of multi-family homes completed multiplied by average square footage of new multi-family homes.
The American housing boom that lasted from 1996 to 2006 was remarkably divorced from economic fundamentals. The boom started with the Clinton-era economic expansion, but then continued long after Internet stocks crashed. Price growth was uncorrelated to local economic growth; even low interest rates cannot explain much of the American real estate cycle (Glaeser, Gottlieb, and Gyourko, 2013).China’s housing boom, by contrast, accompanied epic economic expansion and urbanization. Per capita incomes in China are currently ten times higher than they were a generation ago and economic growth continues. Between 1990 and 2010, the number of city residents in China increased by 335 million people. Yet, even if a massive scale building boom is warranted, China may be building homes in the wrong places, at the wrong quality levels, and at the wrong time.
As Figure 3 shows, between 2000 and 2010, the Chinese housing stock grew proportionately more in locations that were less productive. That fact fuels worries of the “wrong place” problem. The U.S. also builds more in lower income places, which many observers attribute to unfortunate local land use controls that prohibit construction in the most productive parts of America, such as Silicon Valley and New York City. Figure 3 shows that the “wrong place” problem is worse in China than in the U.S. In China, greater construction levels in lower income areas are more likely to reflect aggressive local governments that use construction to bolster GDP growth.
Figure 3a: Construction and Income across U.S. Cities
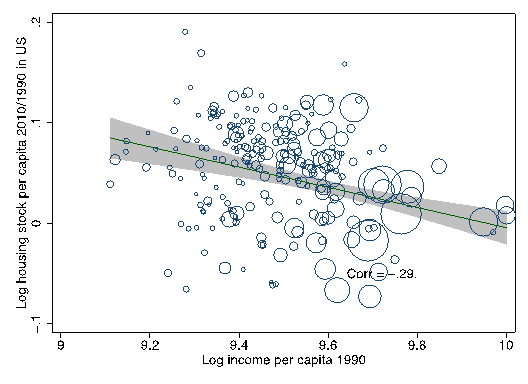
Figure 3b: Construction and Income across Chinese Cities
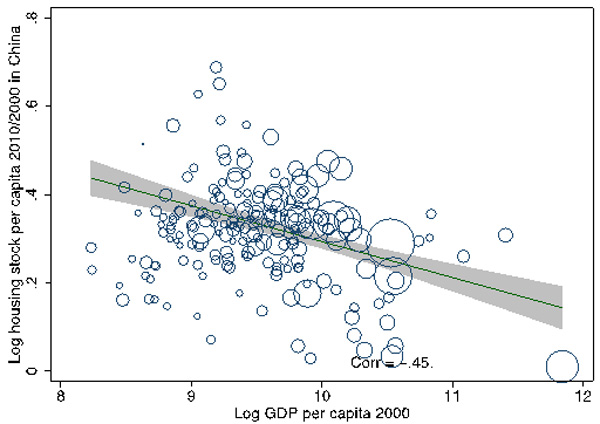
Note: In panel A, housing stock per capita and income per capita for U.S. MSAs are from the decennial census. In panel B, housing stock per capita for Chinese prefecture level cities is from the 2000 and 2010 census and is restricted to counties that are designated “urban” in the 2000 census. The log GDP per capita in 2000 is from the Chinese City Statistical Yearbook 2000 for each city proper. The correlations are weighted by initial city population.
Indeed, the hand of the state is everywhere in the Chinese building sector. The government sets the rules and owns the banks. The government technically owns all the land. But whereas Western stereotypes of public ownership feature images of somnolent, inactive bureaucrats, the Chinese model appears to be almost hyperactive. Local officials are the leaders and not the followers of housing growth.The worry that China is building too soon and at the wrong quality levels is prompted by the high vacancy rates in many Chinese cities. In Tier 3 and Tier 4 cities, high vacancy rates reflect inventory owned by developers, which will need to be eventually sold. In Tier 1 and Tier 2 cities, vacancy rates reflect the investment decisions of private individuals, who buy homes for the future — perhaps for their children, perhaps their own retirement — and leave them unoccupied. These empty investment properties present no macroeconomic risk, but they do suggest that building might have been premature in a certain area.
The fact that so many Chinese buyers see real estate as a longer term store of wealth, not as a short-term speculative play, reduces the risk of homeowner defaults. In China, it is builders and not buyers who pose the greater risk of default and of resulting losses in the banking sector if prices fall. So, how likely is this risk to materialize? In particular, how likely are housing prices to fall in China?
One approach to forecasting future prices is to assume that in twenty years, China will be a “normal” country where prices reflect a reasonable multiple of income. We then project the future distribution of income and new construction and find the point where supply meets demand.
This exercise suggests that a Chinese housing bust is not inevitable. If the central government significantly reduces the flow of new construction, today’s high prices seem sustainable. After all, demand for living in China’s successful cities is likely to remain robust.
The greatest mistake that real estate buyers have made during booms is to underestimate the power of supply to determine market prices. Buyers in Las Vegas in 2005 may have correctly assessed the region’s amenities and economic energy, but they seem to have ignored the economic truth that when supply is almost perfectly elastic, prices cannot remain above construction costs. Similarly, the right question to ask about the future of Chinese real estate is whether unfettered construction will eventually pull prices down to the cost of building.
If current construction levels persist, our estimates suggest that a major price correction is distinctly plausible, even if income growth remains robust. Current supply is purchased in Tier 1 and Tier 2 cities by investors who are betting on the future. Yet eventually, the future will arrive and demand will have to be based on the actual need for housing. If today’s vast construction levels persist, it seems likely that supply will outstrip demand and that prices will fall.
From our perspective, the future of Chinese housing prices is not simply up to the whims of an uncontrollable market. The future of China’s housing prices will be tied to decisions made in Beijing. If the central government wants prices to stay high, it has only to slow down the construction sector.
We are not suggesting that the central government should stop construction. There would be social costs from declining construction employment and reducing the growth of cities. Yet if construction does not decline, it is hard to see how prices can remain at their current levels. The central government therefore faces a crucial choice: 1) Allow construction to continue and cities to grow, but risk the real possibility of a major price drop; or 2) Decrease construction substantially and risk reduced employment and lose the benefits of increased urbanization.
(Edward Glaeser, Department of Economics, Harvard University; Wei Huang, Post-doctoral Fellow at the National Bureau of Economic Research; Yueran Ma, Department of Economics, Harvard University; Andrei Shleifer, Department of Economics, Harvard University.)
References
Demystifying the Chinese Housing Boom, Hanming Fang, Quanlin Gu, Wei Xiong, Li‐An Zhou. In NBER Macroeconomics Annual 2015, Volume 30. Edited by Eichenbaum and Parker. 2016.
Can Cheap Credit Explain the Housing Boom?, Edward L. Glaeser, Joshua D. Gottlieb, Joseph Gyourko. In Housing and the Financial Crisis. Edited by Glaeser and Sinai. 2013.

Latest
Most Popular
- VoxChina Covid-19 Forum (Second Edition): China’s Post-Lockdown Economic Recovery VoxChina, Apr 18, 2020
- China’s Great Housing Boom Kaiji Chen, Yi Wen, Oct 11, 2017
- China’s Joint Venture Policy and the International Transfer of Technology Kun Jiang, Wolfgang Keller, Larry D. Qiu, William Ridley, Feb 06, 2019
- The Dark Side of the Chinese Fiscal Stimulus: Evidence from Local Government Debt Yi Huang, Marco Pagano, Ugo Panizza, Jun 28, 2017
- Wealth Redistribution in the Chinese Stock Market: the Role of Bubbles and Crashes Li An, Jiangze Bian, Dong Lou, Donghui Shi, Jul 01, 2020
- Evaluating Risk across Chinese Housing Markets Yongheng Deng, Joseph Gyourko, Jing Wu, Aug 02, 2017
- What Is Special about China’s Housing Boom? Edward L. Glaeser, Wei Huang, Yueran Ma, Andrei Shleifer, Jun 20, 2017
- Privatization and Productivity in China Yuyu Chen, Mitsuru Igami, Masayuki Sawada, Mo Xiao, Jan 31, 2018
- Daily Price Limits and the Magnet Effect Ting Chen, Zhenyu Gao, Jibao He, Wenxi Jiang, Wei Xiong, Oct 25, 2017
- How did China Move Up the Global Value Chains? Hiau Looi Kee, Heiwai Tang, Aug 30, 2017


