A Bridge on Economic Issues between China and the World


 Facebook
  Twitter
  Instagram
 WeChat
  Email
Email The 2009 Monetary Stimulus in China

Massive monetary injections occurred in 2009Q1-Q4 as a result of a drastic change in monetary policy causing an unprecedented credit expansion in 2009-2011, which stimulated economic growth in the short-run. New credit was disproportionately allocated to real estate and its supporting heavy industries and fueled a sharp rise in land prices.The long-lasting consequence of this monetary stimulus resulted in a twin problem facing China: the high investment-to-GDP and debt-to-GDP ratios.
In the aftermath of the 2008 global financial crisis, central banks around the world (Federal Reserve System, European Central Bank, Bank of Japan, and People’s Bank of China) initiated a massive monetary stimulus in an attempt to combat the crisis and rescue their sagging economies. What are the consequences of such an unusual change of monetary policy on the banking system and the real economy? A rigorous assessment of such consequences is challenging as it involves two distinctive prerequisites. First, one must identify this unusual change of monetary policy from the normal policy course. Second, one needs to quantify the monetary transmission channel through which the identified policy change influences the banking system and the real economy.
In the empirical macroeconomics literature, these two prerequisite tasks are simultaneously undertaken by building up a dynamic multivariate system describing both monetary policy and the rest of the economy (Leeper et al. 1996 and Christiano et al. 1999). Technically, such a system is often expressed in the form of a structural vector autoregression (SVAR). The SVAR framework is developed to answer the question of how much of the observed economic fluctuation is caused by the monetary stimulus — a stimulus initiated by massive monetary injections. This causation analysis allows researchers to disentangle a policy change itself from the effect of such a change.
Cause and Effect of the 2009 Monetary Stimulus
In November 2008, the State Council of China announced a plan to invest 4 trillion RMB in the economy over the two-year period from 2009Q1 to 2010Q4 in an attempt to stem the sharp fall of GDP growth. Based on this announced plan, 2009Q1-2010Q4 is often viewed as a period of change in China’s monetary policy. This casual characterization of a policy change turns out to be inaccurate. The Chinese government’s 4 trillion RMB stimulus plan was not even close to its actual contribution. Most monetary injections occurred in 2009Q1-Q4. M2 increased by 4.2 trillion RMB in 2009Q1 alone and by a total of 11.5 RMB trillion during the 2009Q1-Q3 period. These crucial quarters of massive monetary injections observed in the data are indeed identified by the econometric framework of Chen et al (2017) as a switch in the monetary policy regime, which is a source or cause of the economic stimulation. This change in monetary policy played the most conspicuous role in the implementation of the government’s stimulus plan.
Figure 1 displays the actual M2 growth path versus the counterfactual M2 growth path. The counterfactual path is computed by assuming that monetary policy did not switch to a new regime so that M2 growth remained at 15 percent instead of rising consecutively to 25 percent in 2009Q3. If the People’s Bank of China (PBC) had not changed its policy by drastically increasing the M2 supply in 2009Q1-Q3, M2 growth would have hovered around 15 percent for the next two years (the circle line in the figure). Although a change in monetary policy took place only in 2009Q1-Q3, the effects of this monetary policy change lasted beyond the stimulus period. From the difference between the actual and counterfactual paths in Figure 1, one can see that the actual M2 growth rates in all subsequent periods from 2009Q4 are higher than those on the counterfactual path. Quantifying such a cause and effect analysis is possible within the econometric framework of Chen et al. (2017) because the framework allows one to separate a change in monetary policy from the effect of this change.
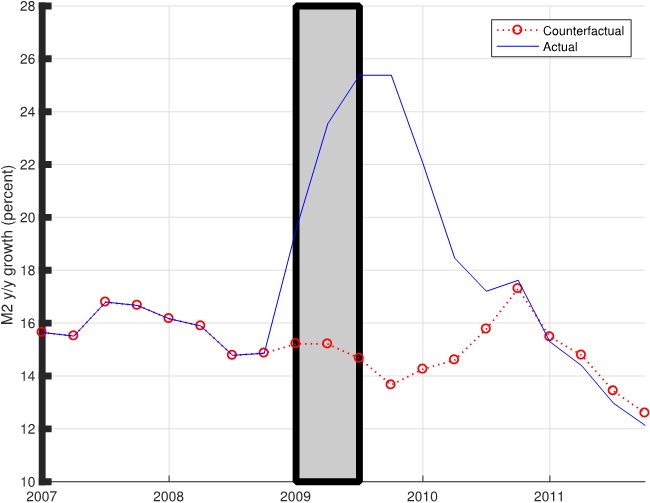
Actual and counterfactual historical paths
of M2 year-over-year (y/y) growth rates. The shaded bar marks the
period of 2009Q1-2009Q3 during which a switch of monetary policy to a
more aggressive stimulation is identified by the econometric model. The
counterfactual path assumes that monetary policy had not changed during
this stimulation period.
Temporary Impacts on the Aggregate Economy
The 2009 monetary stimulus had a significant impact on GDP growth. By the end of 2009, GDP growth reached 11.59 percent with an increase of 4.67 percent above the 6.91 percent growth rate in 2008Q4 (left panel of Figure 2). The portion attributable to the stimulus, measured by the difference between actual and counterfactual paths in the figure, reached 4 percent in 2009Q4 (right panel of Figure 2), which accounts for 85 percent of the 4.67 percent increase. Without the stimulus, actual GDP growth would have been below its official 8 percent target in 2009 and would have been lower by as much as 4 percent during the next two years. The impacts, however, are temporary — the gap between the actual and counterfactual paths began to narrow in 2010 and became negligible by the end of 2011.
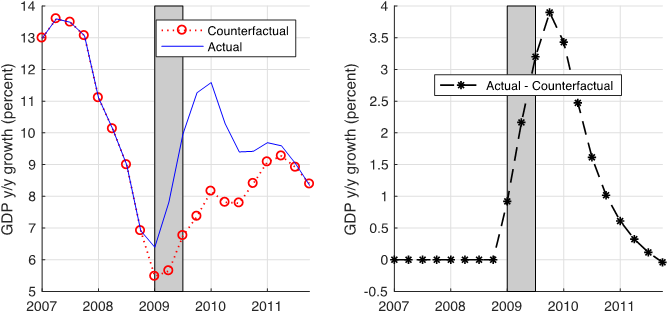
Actual and counterfactual historical paths of GDP year-over-year (y/y) growth rates. The shaded bar marks the period of 2009Q1-2009Q3 during which a switch of monetary policy to a more aggressive stimulation is identified by the econometric model. The counterfactual path assumes that monetary policy did not change during this stimulation period.
Unlike many developed economies such as the U.S., the effect of China’s monetary stimulus on GDP growth is through investment rather than through consumption (which includes consumer durable goods). Figure 3 displays the sharp contrast between the impacts on investment and consumption. The regime switch to an extraordinarily expansionary monetary policy in 2009Q1-Q3 had a negligible effect on consumption growth, but it increased investment growth by as much as 13 percent (the difference between the actual and counterfactual paths in the figure). With the 40 percent investment-to-GDP ratio at the end of 2008, a 13 percent increase in investment growth should contribute to a 4 percent increase in GDP growth by accounting, which is perfectly in line with the magnitude of the stimulus effect on GDP growth displayed in Figure 2.
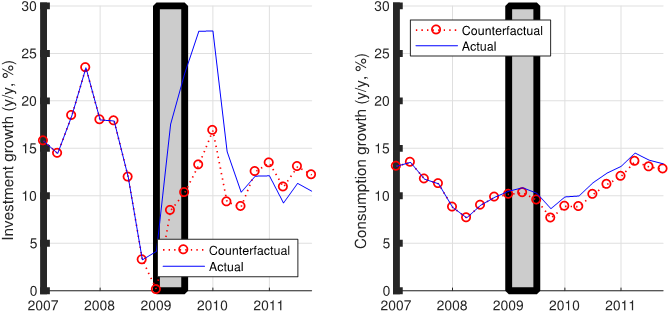
Actual and counterfactual historical paths of year-over-year growth rates of GDP in investment and household consumption. The shaded bar marks the period of 2009Q1-2009Q3 during which a switch of monetary policy to a more aggressive stimulation is identified by the econometric model. The counterfactual path assumes that monetary policy did not change during this stimulation period.
Impacts on Credit Allocation to Real Estate
A conventional view is that state-owned enterprises (SOEs) played a crucial role in the credit allocation during the stimulus period because China has long been a planned economy. The macro data reported by China’s National Bureau of Statistics (NBS), however, provide little support for this view. Figure 4 plots the share of SOEs in industrial sales revenue (left panel) and in aggregate fixed investment (right panel). As both series have experienced a secular decline, the SOE share was already very low prior to the stimulus — about 30 percent in sales revenue and 24 percent in fixed investment. The stimulus did not reverse the declining trend — the SOE share in sales revenue decreased to 28 percent in 2009 and its share in fixed investment increased by only 1-25 percent in 2009Q2.
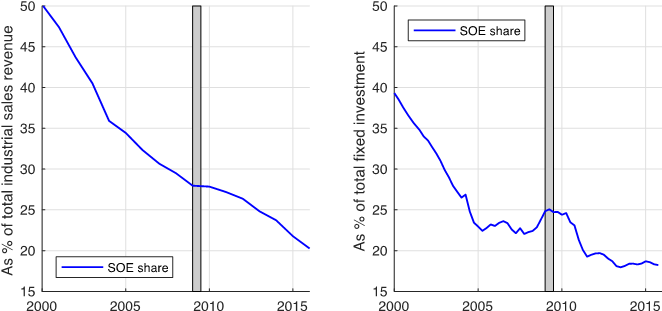
The SOE share from the NBS’s aggregate
data. The shaded bar marks the period of 2009Q1-2009Q3 during which a
switch of monetary policy to a more aggressive stimulation is identified
by the econometric model.
If SOEs were not a major player, which part of the economy was influenced most by the 2009 monetary stimulus? In China, investment is mostly funded by bank loans. The 2009 monetary stimulus increased real bank loans by a rate as high as 10 percent (the difference between actual and counterfactual paths in Figure 5), which has a magnitude close to its impact on M2 growth. Among the ten areas of investment in the government’s stimulus package, real estate was listed as the number one area of focus and consequently received a significant amount of bank credit. A large majority of enterprises in the real estate industry are not SOEs. According to the 2010Q1 monetary policy report, most of the newly-issued bank loans went to real estate and its supporting industries such as infrastructure, steel, and cement. In 2010Q1, the growth rate of new loans allocated to real estate was 38.5 percent and the growth rate of new loans allocated to infrastructure was 33.3 percent.
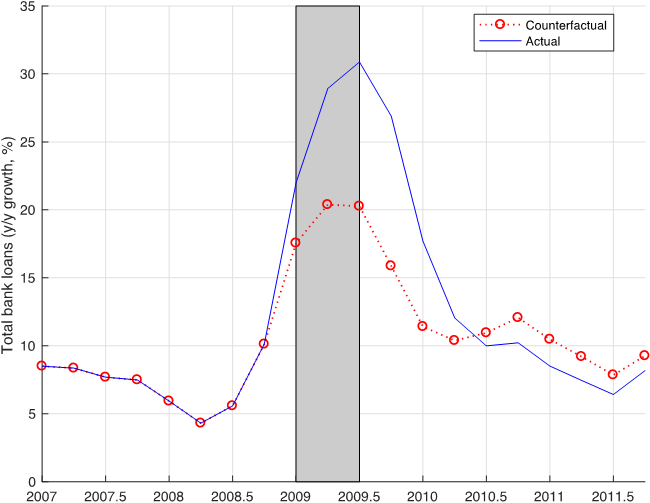
Actual and counterfactual historical paths
of outstanding bank loans (year-over-year growth rates). The shaded bar
marks the period of 2009Q1-2009Q3 during which a switch of monetary
policy to a more aggressive stimulation is identified by the econometric
model. The counterfactual path assumes that monetary policy did not
change during this stimulation period.
Rather than relying on SOEs, the Chinese government placed an emphasis on certain industries for their stimulus plan. These industries include real estate, infrastructure, and manufacturing industries often labeled by the Chinese government as “heavy industries.” Chang et al. (2016) group all these capital-intensive industries into one sector, called the “heavy sector,” and the remaining industries (e.g., education, healthcare, and scientific research) into another category called the “light sector.” Since the late 1990s, the government has viewed most industries in the heavy sector as strategically important and has supported them with preferential credit. Bank loans for financing investments in the heavy sector (“heavy loans”) as a share of GDP was 7.1 percent prior to the stimulus, much higher than the level of 1.3 percent for the light sector (“light loans”). The asymmetry of credit allocation in the stimulus is even more important — the increase of heavy loans as a percent of GDP (from 7.1 percent in 2008Q4 to 9.4 percent in 2009Q4) was three times as large as that of light loans (from 1.3 percent to 2.1 percent for the same period). A majority of the increase in heavy loans was channeled to real estate as the ratio of real estate loans to GDP rose to 4.2 percent during 2009-2010, which was close to half of the ratio of heavy loans to GDP.
New credit disproportionately allocated to real estate fueled a sharp rise in the land price. In the U.S. and other developed economies, the credit boom was associated with mortgage loans demanded by households. In China, a majority of new bank credit was allocated to investment, especially in the heavy sector. This preferential credit allocation pushed up the demand for land. Given the limited supply of land in large cities, therefore, an increase of bank credit to real estate generated soaring (real) land prices during and after the stimulus period (see Note 1).
The close relationship between real estate loans and land prices can be seen in Figure 6. The stimulus effects on real estate loans and land prices were very similar in 2009 and 2010. This finding is consistent with the theoretical prediction based on two-way interactions — an increase of real estate loans pushed up the land price, which in turn relaxed the collateral constraint and encouraged banks to lend more to real estate developers with real estate as collateral (Liu et al. 2013). This finding is further supported by Chen et al. (2017), who document how an increase in the land price (the real estate boom) leads to more investment in real estate or investment by firms using land as collateral.
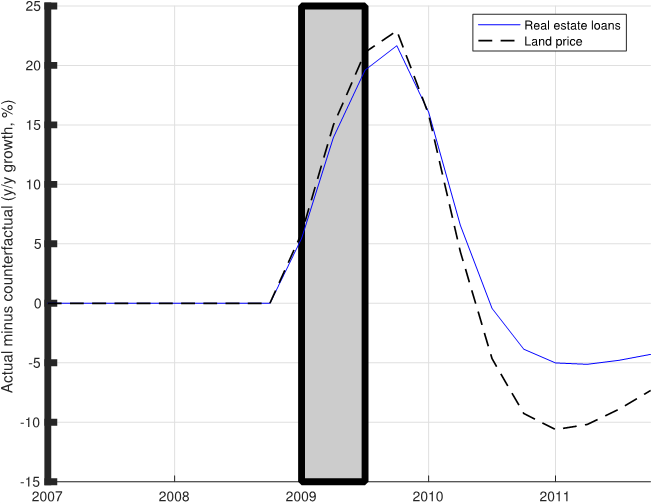
Historical paths of year-over-year growth
rates of land price growth and newly-originated loans to the real estate
sector. The shaded bar marks the period of 2009Q1-2009Q3 during which a
switch of monetary policy to a more aggressive stimulation is
identified by the econometric model. The counterfactual path assumes
that monetary policy did not change during this stimulation period.
Tradeoff between Short-term Growth and Long-term Debt
The transmission of the 2009 monetary stimulus to the macroeconomy via asymmetric credit allocation bears lasting consequences. Despite an already high investment rate at the end of 2008, the 2009 monetary stimulus raised the investment-to-GDP ratio by more than 4 percent (left panel of Figure 7) and the debt-to-GDP ratio by a rate as high as 13 percent (right panel of Figure 7) by 2016. Most of the new bank loans during the stimulus period were advanced to the heavy sector for financing time-to-build investments and were thus allocated as long-term loans. This made the impacts on the investment-to-GDP and debt-to-GDP ratios persistent, even though the stimulus itself was temporary (i.e., only three quarters).
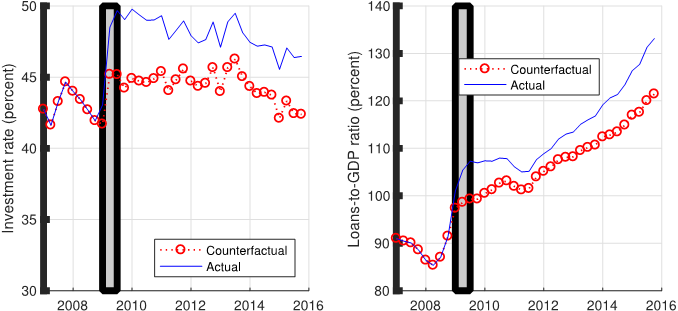
Actual and counterfactual historical paths
of the investment-to-GDP ratio and the debt-to-GDP ratio (the ratio of
bank loans to GDP). The shaded bar marks the period of 2009Q1-2009Q3
during which a switch of monetary policy to a more aggressive
stimulation is identified by the econometric model. The counterfactual
path assumes that monetary policy did not change during this stimulation
period.
Such persistent effects have exposed China’s economy to overinvestment. Indeed, the IMF 2016 Country Report No. 16/270 and 2017 Country Report No. 17/247 express concerns about “excess capacity in real estate and heavy industry” in China and its impact on global commodity prices. In 2015, for example, there were six industries that suffered a most severe overcapacity problem measured by the rate of capacity utilization: steel (67 percent), coal (64.9 percent), cement (73.8 percent), flat glass (68.0 percent), electrolytic aluminum (75.4 percent), and shipbuilding (69 percent) (see Note 2). All six industries are heavy industries according to the Chinese government’s official classification.
Perhaps a graver situation is the fast accumulation of vacant real estate stock. Measured by floor space, real estate vacancy increased from 199.47 million square meters in 2009 to 718.53 million square meters in 2015. To give a sense of the severity of the situation from this overly built real estate stock, 718.53 million square meters can accommodate 24 million individuals in China. This oversupply of real estate properties has raised serious concerns for the rising debt-to-GDP ratio, as more than half of the newly-originated bank credit during the 2009 stimulus was allocated to the real estate sector. To deal with the problems of rising debt, industrial overcapacity, and oversupply in real estate, the Central Economic Work Conference — organized jointly by the State Council and the Central Committee of Communist Party of China — has listed, among top major tasks, three specific objectives: deleveraging debt, reducing excess capacity, and destocking real estate. This article demonstrates that underlying all these problems facing the Chinese government is the asymmetric credit allocation wrought by its 2009 monetary stimulus.
Authors’ note: The views expressed herein are those of the authors and do not necessarily reflect the views of the Federal Reserve Bank of Atlanta or the Federal Reserve System.
Note 1: Chen and Wen (2017) provide a theory to explain the rapid increase of house/land prices in China.
Note 2: These figures were published in the 12/23/2016 Economic Research Report of the State Council’s National Development and Reform Commission (http://www.sic.gov.cn/News/455/7349.htm). By international standards, an industry has an excess capacity if its rate of capacity utilization is between 75 percent and 79 percent and it suffers a severe overcapacity if the rate is below 75 percent.
Chang, C., K. Chen, D. F. Waggoner, and T. Zha (2016): “Trends and Cycles in China’s Macroeconomy.” In NBER Macroeconomics Annual 2015. Chicago, IL: University of Chicago Press. https://www.journals.uchicago.edu/doi/abs/10.1086/685949.
Chen, K., P. Higgins, D. F. Waggoner, and T. Zha (2017): “Impacts of Monetary Stimulus on Credit Allocation and Macroeconomy: Evidence from China,” NBER Working Paper No. 22650, September, 2017. http://www.nber.org/papers/w22650.
Chen, T., L. Liu, W. Xiong, and L. Zhou (2017), “Real Estate Boom and Misallocation of Capital in China,” Unpublished Manuscript, Princeton University. http://faculty.chicagobooth.edu/workshops/finance/pdf/Xiong-land_investment_6E.pdf.
Chen, K., and Y. Wen (2017): “The Great Housing Boom of China,” American Economic Journal: Macroeconomics 9(2): 73-114. https://www.aeaweb.org/articles?id=10.1257/mac.20140234.
Christiano, L. J., M. S. Eichenbaum, and C. L. Evans (1999): “Monetary Policy Shocks: What Have We Learned and To What End?” In Handbook of Macroeconomics. Volume 1A. Edited by J. B. Taylor and M. Woodford. Amsterdam, Netherlands: North Holland. https://www.sciencedirect.com/science/article/pii/S1574004899010058.
Leeper, E. M., C. A. Sims, and T. Zha (1996): “What Does Monetary Policy Do?,” Brookings Papers on Economic Activity 2: 1-78. https://www.brookings.edu/bpea-articles/what-does-monetary-policy-do/.
In the aftermath of the 2008 global financial crisis, central banks around the world (Federal Reserve System, European Central Bank, Bank of Japan, and People’s Bank of China) initiated a massive monetary stimulus in an attempt to combat the crisis and rescue their sagging economies. What are the consequences of such an unusual change of monetary policy on the banking system and the real economy? A rigorous assessment of such consequences is challenging as it involves two distinctive prerequisites. First, one must identify this unusual change of monetary policy from the normal policy course. Second, one needs to quantify the monetary transmission channel through which the identified policy change influences the banking system and the real economy.
In the empirical macroeconomics literature, these two prerequisite tasks are simultaneously undertaken by building up a dynamic multivariate system describing both monetary policy and the rest of the economy (Leeper et al. 1996 and Christiano et al. 1999). Technically, such a system is often expressed in the form of a structural vector autoregression (SVAR). The SVAR framework is developed to answer the question of how much of the observed economic fluctuation is caused by the monetary stimulus — a stimulus initiated by massive monetary injections. This causation analysis allows researchers to disentangle a policy change itself from the effect of such a change.
Cause and Effect of the 2009 Monetary Stimulus
In November 2008, the State Council of China announced a plan to invest 4 trillion RMB in the economy over the two-year period from 2009Q1 to 2010Q4 in an attempt to stem the sharp fall of GDP growth. Based on this announced plan, 2009Q1-2010Q4 is often viewed as a period of change in China’s monetary policy. This casual characterization of a policy change turns out to be inaccurate. The Chinese government’s 4 trillion RMB stimulus plan was not even close to its actual contribution. Most monetary injections occurred in 2009Q1-Q4. M2 increased by 4.2 trillion RMB in 2009Q1 alone and by a total of 11.5 RMB trillion during the 2009Q1-Q3 period. These crucial quarters of massive monetary injections observed in the data are indeed identified by the econometric framework of Chen et al (2017) as a switch in the monetary policy regime, which is a source or cause of the economic stimulation. This change in monetary policy played the most conspicuous role in the implementation of the government’s stimulus plan.
Figure 1 displays the actual M2 growth path versus the counterfactual M2 growth path. The counterfactual path is computed by assuming that monetary policy did not switch to a new regime so that M2 growth remained at 15 percent instead of rising consecutively to 25 percent in 2009Q3. If the People’s Bank of China (PBC) had not changed its policy by drastically increasing the M2 supply in 2009Q1-Q3, M2 growth would have hovered around 15 percent for the next two years (the circle line in the figure). Although a change in monetary policy took place only in 2009Q1-Q3, the effects of this monetary policy change lasted beyond the stimulus period. From the difference between the actual and counterfactual paths in Figure 1, one can see that the actual M2 growth rates in all subsequent periods from 2009Q4 are higher than those on the counterfactual path. Quantifying such a cause and effect analysis is possible within the econometric framework of Chen et al. (2017) because the framework allows one to separate a change in monetary policy from the effect of this change.
Figure 1
Temporary Impacts on the Aggregate Economy
The 2009 monetary stimulus had a significant impact on GDP growth. By the end of 2009, GDP growth reached 11.59 percent with an increase of 4.67 percent above the 6.91 percent growth rate in 2008Q4 (left panel of Figure 2). The portion attributable to the stimulus, measured by the difference between actual and counterfactual paths in the figure, reached 4 percent in 2009Q4 (right panel of Figure 2), which accounts for 85 percent of the 4.67 percent increase. Without the stimulus, actual GDP growth would have been below its official 8 percent target in 2009 and would have been lower by as much as 4 percent during the next two years. The impacts, however, are temporary — the gap between the actual and counterfactual paths began to narrow in 2010 and became negligible by the end of 2011.
Figure 2
Actual and counterfactual historical paths of GDP year-over-year (y/y) growth rates. The shaded bar marks the period of 2009Q1-2009Q3 during which a switch of monetary policy to a more aggressive stimulation is identified by the econometric model. The counterfactual path assumes that monetary policy did not change during this stimulation period.
Unlike many developed economies such as the U.S., the effect of China’s monetary stimulus on GDP growth is through investment rather than through consumption (which includes consumer durable goods). Figure 3 displays the sharp contrast between the impacts on investment and consumption. The regime switch to an extraordinarily expansionary monetary policy in 2009Q1-Q3 had a negligible effect on consumption growth, but it increased investment growth by as much as 13 percent (the difference between the actual and counterfactual paths in the figure). With the 40 percent investment-to-GDP ratio at the end of 2008, a 13 percent increase in investment growth should contribute to a 4 percent increase in GDP growth by accounting, which is perfectly in line with the magnitude of the stimulus effect on GDP growth displayed in Figure 2.
Figure 3
Actual and counterfactual historical paths of year-over-year growth rates of GDP in investment and household consumption. The shaded bar marks the period of 2009Q1-2009Q3 during which a switch of monetary policy to a more aggressive stimulation is identified by the econometric model. The counterfactual path assumes that monetary policy did not change during this stimulation period.
Impacts on Credit Allocation to Real Estate
A conventional view is that state-owned enterprises (SOEs) played a crucial role in the credit allocation during the stimulus period because China has long been a planned economy. The macro data reported by China’s National Bureau of Statistics (NBS), however, provide little support for this view. Figure 4 plots the share of SOEs in industrial sales revenue (left panel) and in aggregate fixed investment (right panel). As both series have experienced a secular decline, the SOE share was already very low prior to the stimulus — about 30 percent in sales revenue and 24 percent in fixed investment. The stimulus did not reverse the declining trend — the SOE share in sales revenue decreased to 28 percent in 2009 and its share in fixed investment increased by only 1-25 percent in 2009Q2.
Figure 4
If SOEs were not a major player, which part of the economy was influenced most by the 2009 monetary stimulus? In China, investment is mostly funded by bank loans. The 2009 monetary stimulus increased real bank loans by a rate as high as 10 percent (the difference between actual and counterfactual paths in Figure 5), which has a magnitude close to its impact on M2 growth. Among the ten areas of investment in the government’s stimulus package, real estate was listed as the number one area of focus and consequently received a significant amount of bank credit. A large majority of enterprises in the real estate industry are not SOEs. According to the 2010Q1 monetary policy report, most of the newly-issued bank loans went to real estate and its supporting industries such as infrastructure, steel, and cement. In 2010Q1, the growth rate of new loans allocated to real estate was 38.5 percent and the growth rate of new loans allocated to infrastructure was 33.3 percent.
Figure 5
Rather than relying on SOEs, the Chinese government placed an emphasis on certain industries for their stimulus plan. These industries include real estate, infrastructure, and manufacturing industries often labeled by the Chinese government as “heavy industries.” Chang et al. (2016) group all these capital-intensive industries into one sector, called the “heavy sector,” and the remaining industries (e.g., education, healthcare, and scientific research) into another category called the “light sector.” Since the late 1990s, the government has viewed most industries in the heavy sector as strategically important and has supported them with preferential credit. Bank loans for financing investments in the heavy sector (“heavy loans”) as a share of GDP was 7.1 percent prior to the stimulus, much higher than the level of 1.3 percent for the light sector (“light loans”). The asymmetry of credit allocation in the stimulus is even more important — the increase of heavy loans as a percent of GDP (from 7.1 percent in 2008Q4 to 9.4 percent in 2009Q4) was three times as large as that of light loans (from 1.3 percent to 2.1 percent for the same period). A majority of the increase in heavy loans was channeled to real estate as the ratio of real estate loans to GDP rose to 4.2 percent during 2009-2010, which was close to half of the ratio of heavy loans to GDP.
New credit disproportionately allocated to real estate fueled a sharp rise in the land price. In the U.S. and other developed economies, the credit boom was associated with mortgage loans demanded by households. In China, a majority of new bank credit was allocated to investment, especially in the heavy sector. This preferential credit allocation pushed up the demand for land. Given the limited supply of land in large cities, therefore, an increase of bank credit to real estate generated soaring (real) land prices during and after the stimulus period (see Note 1).
The close relationship between real estate loans and land prices can be seen in Figure 6. The stimulus effects on real estate loans and land prices were very similar in 2009 and 2010. This finding is consistent with the theoretical prediction based on two-way interactions — an increase of real estate loans pushed up the land price, which in turn relaxed the collateral constraint and encouraged banks to lend more to real estate developers with real estate as collateral (Liu et al. 2013). This finding is further supported by Chen et al. (2017), who document how an increase in the land price (the real estate boom) leads to more investment in real estate or investment by firms using land as collateral.
Figure 6
Tradeoff between Short-term Growth and Long-term Debt
The transmission of the 2009 monetary stimulus to the macroeconomy via asymmetric credit allocation bears lasting consequences. Despite an already high investment rate at the end of 2008, the 2009 monetary stimulus raised the investment-to-GDP ratio by more than 4 percent (left panel of Figure 7) and the debt-to-GDP ratio by a rate as high as 13 percent (right panel of Figure 7) by 2016. Most of the new bank loans during the stimulus period were advanced to the heavy sector for financing time-to-build investments and were thus allocated as long-term loans. This made the impacts on the investment-to-GDP and debt-to-GDP ratios persistent, even though the stimulus itself was temporary (i.e., only three quarters).
Figure 7
Such persistent effects have exposed China’s economy to overinvestment. Indeed, the IMF 2016 Country Report No. 16/270 and 2017 Country Report No. 17/247 express concerns about “excess capacity in real estate and heavy industry” in China and its impact on global commodity prices. In 2015, for example, there were six industries that suffered a most severe overcapacity problem measured by the rate of capacity utilization: steel (67 percent), coal (64.9 percent), cement (73.8 percent), flat glass (68.0 percent), electrolytic aluminum (75.4 percent), and shipbuilding (69 percent) (see Note 2). All six industries are heavy industries according to the Chinese government’s official classification.
Perhaps a graver situation is the fast accumulation of vacant real estate stock. Measured by floor space, real estate vacancy increased from 199.47 million square meters in 2009 to 718.53 million square meters in 2015. To give a sense of the severity of the situation from this overly built real estate stock, 718.53 million square meters can accommodate 24 million individuals in China. This oversupply of real estate properties has raised serious concerns for the rising debt-to-GDP ratio, as more than half of the newly-originated bank credit during the 2009 stimulus was allocated to the real estate sector. To deal with the problems of rising debt, industrial overcapacity, and oversupply in real estate, the Central Economic Work Conference — organized jointly by the State Council and the Central Committee of Communist Party of China — has listed, among top major tasks, three specific objectives: deleveraging debt, reducing excess capacity, and destocking real estate. This article demonstrates that underlying all these problems facing the Chinese government is the asymmetric credit allocation wrought by its 2009 monetary stimulus.
Authors’ note: The views expressed herein are those of the authors and do not necessarily reflect the views of the Federal Reserve Bank of Atlanta or the Federal Reserve System.
Note 1: Chen and Wen (2017) provide a theory to explain the rapid increase of house/land prices in China.
Note 2: These figures were published in the 12/23/2016 Economic Research Report of the State Council’s National Development and Reform Commission (http://www.sic.gov.cn/News/455/7349.htm). By international standards, an industry has an excess capacity if its rate of capacity utilization is between 75 percent and 79 percent and it suffers a severe overcapacity if the rate is below 75 percent.
(Kaiji Chen, Economics Department, Emory University and the Federal Reserve Bank of Atlanta; Patrick Higgins, Federal Reserve Bank of Atlanta; Daniel F. Waggoner, Federal Reserve Bank of Atlanta; Tao Zha, Federal Reserve Bank of Atlanta and Emory University.)
Chang, C., K. Chen, D. F. Waggoner, and T. Zha (2016): “Trends and Cycles in China’s Macroeconomy.” In NBER Macroeconomics Annual 2015. Chicago, IL: University of Chicago Press. https://www.journals.uchicago.edu/doi/abs/10.1086/685949.
Chen, K., P. Higgins, D. F. Waggoner, and T. Zha (2017): “Impacts of Monetary Stimulus on Credit Allocation and Macroeconomy: Evidence from China,” NBER Working Paper No. 22650, September, 2017. http://www.nber.org/papers/w22650.
Chen, T., L. Liu, W. Xiong, and L. Zhou (2017), “Real Estate Boom and Misallocation of Capital in China,” Unpublished Manuscript, Princeton University. http://faculty.chicagobooth.edu/workshops/finance/pdf/Xiong-land_investment_6E.pdf.
Chen, K., and Y. Wen (2017): “The Great Housing Boom of China,” American Economic Journal: Macroeconomics 9(2): 73-114. https://www.aeaweb.org/articles?id=10.1257/mac.20140234.
Christiano, L. J., M. S. Eichenbaum, and C. L. Evans (1999): “Monetary Policy Shocks: What Have We Learned and To What End?” In Handbook of Macroeconomics. Volume 1A. Edited by J. B. Taylor and M. Woodford. Amsterdam, Netherlands: North Holland. https://www.sciencedirect.com/science/article/pii/S1574004899010058.
Leeper, E. M., C. A. Sims, and T. Zha (1996): “What Does Monetary Policy Do?,” Brookings Papers on Economic Activity 2: 1-78. https://www.brookings.edu/bpea-articles/what-does-monetary-policy-do/.
Liu, Z., P. Wang, and T. Zha (2013): “Land-price Dynamics and Macroeconomic Fluctuations,” Econometrica 81(3): 1147-1184. http://onlinelibrary.wiley.com/doi/10.3982/ECTA8994/abstract

Latest
Most Popular
- VoxChina Covid-19 Forum (Second Edition): China’s Post-Lockdown Economic Recovery VoxChina, Apr 18, 2020
- China’s Great Housing Boom Kaiji Chen, Yi Wen, Oct 11, 2017
- China’s Joint Venture Policy and the International Transfer of Technology Kun Jiang, Wolfgang Keller, Larry D. Qiu, William Ridley, Feb 06, 2019
- The Dark Side of the Chinese Fiscal Stimulus: Evidence from Local Government Debt Yi Huang, Marco Pagano, Ugo Panizza, Jun 28, 2017
- Wealth Redistribution in the Chinese Stock Market: the Role of Bubbles and Crashes Li An, Jiangze Bian, Dong Lou, Donghui Shi, Jul 01, 2020
- Evaluating Risk across Chinese Housing Markets Yongheng Deng, Joseph Gyourko, Jing Wu, Aug 02, 2017
- What Is Special about China’s Housing Boom? Edward L. Glaeser, Wei Huang, Yueran Ma, Andrei Shleifer, Jun 20, 2017
- Privatization and Productivity in China Yuyu Chen, Mitsuru Igami, Masayuki Sawada, Mo Xiao, Jan 31, 2018
- How did China Move Up the Global Value Chains? Hiau Looi Kee, Heiwai Tang, Aug 30, 2017
- Daily Price Limits and the Magnet Effect Ting Chen, Zhenyu Gao, Jibao He, Wenxi Jiang, Wei Xiong, Oct 25, 2017


