A Bridge on Economic Issues between China and the World


 Facebook
  Twitter
  Instagram
 WeChat
  Email
Email How Credible Is Hong Kong’s Currency Peg
We build a target-zone option-pricing model with an endogenous break probability for Hong Kong’s Linked Exchange Rate System. Using daily spot exchange rates and derivatives prices, we estimate a peg-survival probability p and an implied fundamental value of V for HKD under an alternative regime. The results help interpret episodes like the summer of 2025 and show how rates, liquidity, and renminbi movements shape market perceptions, providing a practical monitoring lens for policymakers and market participants.
A summer of two-sided stress
Between May and July 2025, the Hong Kong dollar experienced one of its most turbulent episodes since the Linked Exchange Rate System (LERS) was introduced in 1983. In early May, a sharp depreciation of the US dollar and record capital inflows from mainland China pushed the HKD to the strong-side limit of its permitted band at 7.75 HKD per USD. The Hong Kong Monetary Authority (HKMA) intervened by selling HKD and injecting liquidity—pushing down local interbank rates and, perversely, fueling new carry trades. By late June, those flows reversed. The HKD weakened toward the weak-side limit of 7.85, and the HKMA was forced to purchase HKD 86.93 billion to defend the peg. Within the space of a few weeks, the authority had intervened on both sides of the convertibility zone—a two-sided dynamic quite unlike the slow-burning, one-directional crises of textbook currency attacks.
This episode is the latest in a series of stress tests that Hong Kong’s peg has faced in recent years. In late 2022, the Federal Reserve’s aggressive tightening cycle opened a large gap between US LIBOR and Hong Kong HIBOR, incentivizing carry trades out of the Hong Kong dollar. The aggregate balance—the pool of interbank liquidity in the banking system—fell by more than 90% from its 2021 peak. In August 2019, the renminbi’s depreciation past seven yuan per dollar amid the US–China trade war had already shaken market confidence. Each episode renewed the fundamental question: how credible is the LERS, and how should that credibility be measured?
Why measuring peg credibility is harder than it looks
The standard practitioner’s tool for extracting credibility estimates from derivatives markets is the risk-neutral density approach of Malz (1997), which recovers the market-implied probability distribution of future exchange rates from the prices of currency options. Applied to Hong Kong by Genberg and Hui (2011), this approach has the advantage of being model-light. But it inherits a critical assumption from the Black-Scholes framework: the exchange rate follows a log-normal distribution, producing a bell-shaped density. For a currency under a hard peg, this assumption is badly misspecified.
The empirical distribution of the USD-HKD exchange rate is decidedly U-shaped, as shown in Figure 1. Because the HKMA intervenes whenever the rate approaches either boundary, the exchange rate spends most of its time near 7.75 or 7.85, not near the midpoint of 7.80. A bell-shaped model fitted to this U-shaped reality will systematically overstate the probability that the rate breaks out of the band. The Black-Scholes model, applied naively to HKD options, implies an average 90-day probability of 67% that the rate breaches the upper bound of 7.85—a number that is plainly at odds with four decades of peg survival.
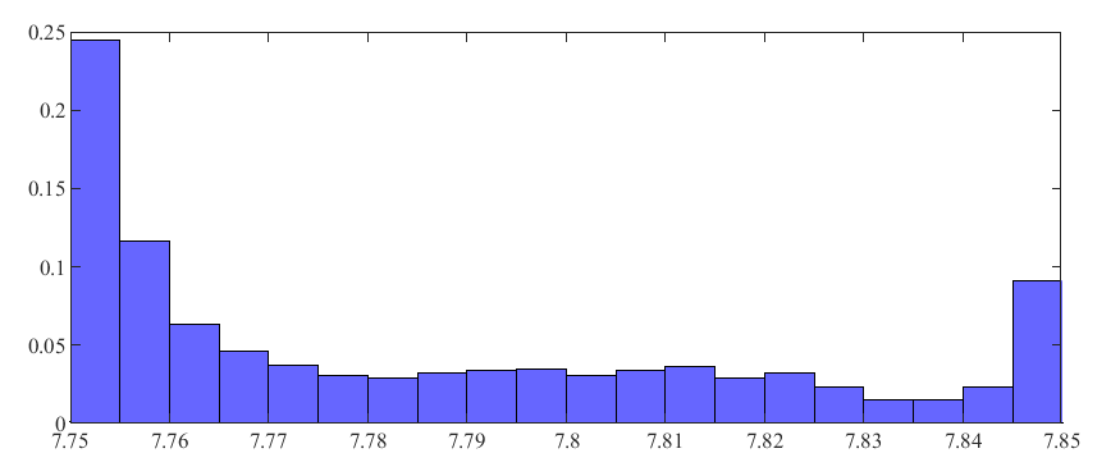
Figure 1. Empirical distribution of the daily USD-HKD exchange rate, January 2007–July 2025. The U-shaped pattern—with probability mass concentrated near the 7.75 and 7.85 convertibility limits—is fundamentally inconsistent with the bell-shaped distribution assumed by Black-Scholes-based approaches.
A model built for a currency board
We develop an asset-pricing model that correctly incorporates the architecture of a currency board. The framework builds on the target-zone tradition initiated by Krugman (1991), which showed that the expectation of future boundary interventions compresses exchange-rate movements inside the band even before those boundaries are reached—the so-called “honeymoon effect.” Two innovations adapt this tradition to the problem at hand.
First, the equilibrium exchange rate is derived from a no-arbitrage condition rather than uncovered interest parity. This follows the approach of Jermann (2017), who used a similar structure to study the Swiss National Bank’s cap on the euro-franc rate between 2011 and 2015. Uncovered interest parity fails systematically in the data. Ignoring foreign risk premia for currency pegs may thus overstate de-peg risk.
Second, and most distinctively, the model makes credibility endogenous. Each period the peg continues with probability p and breaks with probability 1 − p. In the event of a break, the exchange rate jumps to its “fundamental value” V—the level that would prevail under a free float, pinned down by the no-arbitrage condition. Working in continuous time, the paper shows that the equilibrium exchange rate is an S-shaped function of V in the interior of the band, consistent with the honeymoon effect, and flat at the boundaries. Critically, the model’s implied exchange-rate distribution is U-shaped, closely matching the empirical histogram in Figure 1.
Armed with this structure, we also derive closed-form pricing formulas for HKD puts and calls. Option prices are a probability-weighted average of two components: a “peg-regime” component, which accounts for the truncated distribution inside the band, and a “free-float” component given by a standard Black-Scholes formula applied to the fundamental value V. This closed form makes estimation efficient and transparent.
Estimating credibility: Three crises and one new framework
The model is estimated daily over 2007–2025, fitting four three-month HKD option contracts (10Δ and 25Δ puts and calls) alongside the spot rate, with HIBOR and LIBOR taken directly from market data. This yields daily time series for the peg survival probability p, the fundamental value V, and volatility σV. Figure 2 displays the main results.
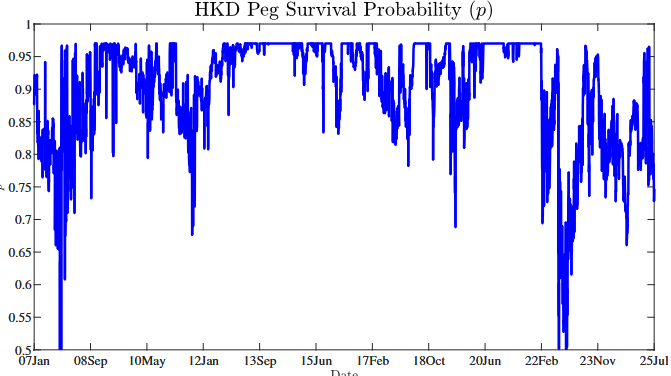
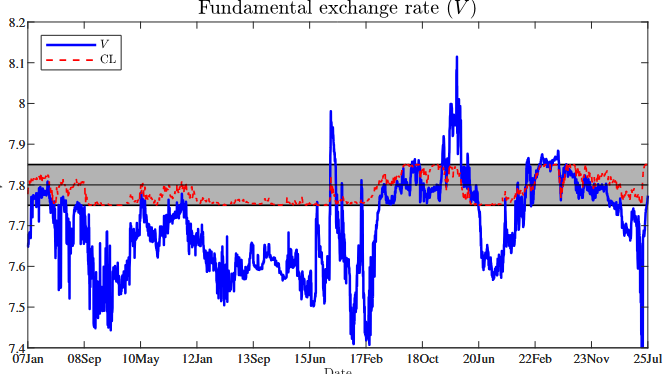
Figure 2. Panel (a): Estimated three-month probability p that the HKD peg remains intact. Panel (b): Estimated fundamental exchange rate V (blue) and observed closing spot USD-HKD rate (red); the shaded area is the 7.75–7.85 convertibility zone. Source: Jermann, Wei, and Yue (2025).
Three stress episodes are plainly visible. In August 2019, renminbi weakness past seven per dollar—a psychologically significant threshold during the US–China trade war—pushed p down to roughly 69%. In late 2022, p collapsed to approximately 50%, the lowest reading since the global financial crisis of 2008–2009, driven by the Fed’s tightening, a widening LIBOR-HIBOR gap, and the 90% drawdown in the aggregate balance. And in 2025, the two-sided capital flow volatility described at the outset is captured as a sharp decline in p—reflecting not the one-sided depreciation pressure of prior crises but a new kind of fragility in which rapid flow reversals destabilize both the strong and the weak side of the peg within a single summer.
Figure 3 compares these estimates with those from Black-Scholes and from the Malz (1997) density method used by Genberg and Hui (2011). The Malz-based estimates improve on Black-Scholes—they partially recover the U-shaped character of the HKD distribution—but remain far below the new model’s estimates. The average implied break-out probability in the new model is just 3% across the sample, against 67% for Black-Scholes. The gap illustrates why model choice matters: a regulator using Black-Scholes would have been in a state of near-permanent alarm over a peg that has in fact survived for more than 40 years.
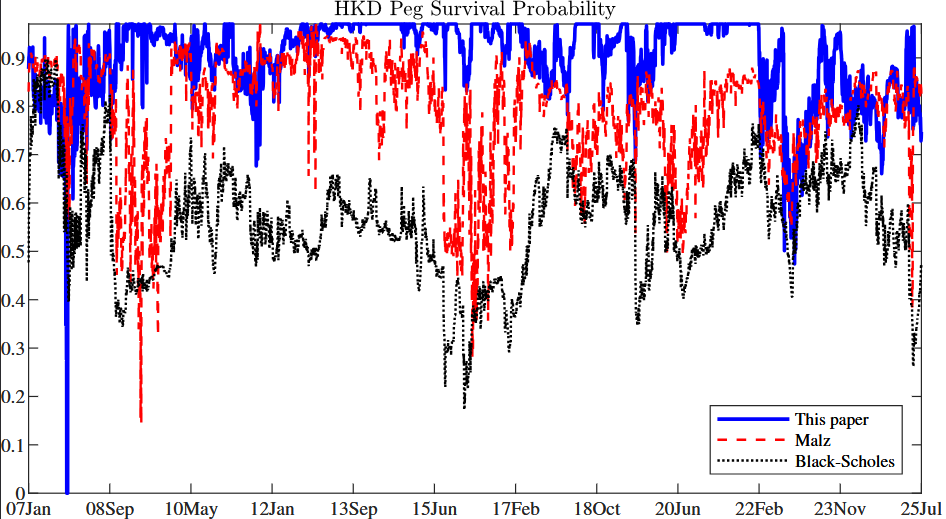
Figure 3. Estimated probability that the USD-HKD exchange rate remains within the convertibility band: Jermann, Wei, and Yue (2025) model (solid blue); Malz (1997) risk-neutral density method (dashed red); standard Black-Scholes (dotted black). Source: Jermann, Wei, and Yue (2025).
What drives credibility: Rates, liquidity, and the renminbi
To understand the economic forces behind these fluctuations, we regress the estimated p and V on a set of fundamentals: interbank liquidity, foreign reserves, the monetary base, the onshore (CNY) and offshore (CNH) renminbi rates, and the HIBOR-LIBOR interest rate differential. Three findings stand out.
Interest rate differentials. A higher HIBOR relative to LIBOR strengthens both V and p: higher local rates attract capital that supports the HKD and reduce the incentive for carry trades against the peg. US rate hikes have the opposite effect, as 2022 dramatically illustrated.
Banking system liquidity. The interbank aggregate balance has a strong positive relationship with p. Higher liquidity reduces the risk of a self-fulfilling run and gives the HKMA room to absorb outflows without tightening credit conditions. The drop of the aggregate balance from over HKD 300 billion in early 2022 to below HKD 50 billion by mid-2023 is the most striking quantitative marker of that period’s credibility stress. The rapid injection and subsequent withdrawal of liquidity during the May–July 2025 episode similarly move the estimated p.
Chinese renminbi dynamics. CNY and CNH depreciation is significantly negatively correlated with p: renminbi weakness raises the market-perceived probability of the peg breaking. Conversely, the fundamental value V is positively correlated with CNY and CNH, suggesting that markets view the renminbi as the likely anchor for the HKD in any post-LERS scenario rather than a free float. Hong Kong’s deep financial integration with the mainland makes this an intuitive and important finding for debates about the territory’s long-term monetary architecture.
A real-time monitoring lens for peg credibility
The framework offers a practical way to summarize how financial markets are pricing risks around the LERS on a day-to-day basis. Because it is estimated from foreign exchange derivatives prices, it produces a daily market-based indicator of the peg credibility even when the spot rate remains inside the convertibility zone. The model’s estimates also speak to how markets think about the longer-run monetary environment. In particular, the inferred “fundamental” value V tends to co-move with CNY and CNH, which is consistent with the view that if the regime were ever to evolve the market’s focal point would be some form of managed link to the renminbi rather than a pure free float.
Taken together, these results suggest that derivatives-based measures can complement traditional indicators of exchange-rate pressures and help frame the policy discussion in a more quantitative way, especially in periods when stresses are two-sided and driven by volatile capital flows.
References
Genberg, Hans, and Cho-Hoi Hui. 2011. “The Credibility of Hong Kong’s Link from the Perspective of Modern Financial Theory.” Journal of Money, Credit, and Banking 43 (1): 185–206. https://doi.org/10.1111/j.1538-4616.2010.00370.x.
Jermann, Urban J. 2017. “Financial Markets’ Views about the Euro–Swiss Franc Floor.” Journal of Money, Credit, and Banking 49 (2–3): 553–65. https://doi.org/10.1111/jmcb.12389.
Jermann, Urban, Bin Wei, and Vivian Yue. 2025. “How Credible Is Hong Kong’s Currency Peg?” National Bureau of Economic Research Working Paper No. 34300. https://www.nber.org/papers/w34300.
Krugman, Paul R. 1991. “Target Zones and Exchange Rate Dynamics.” Quarterly Journal of Economics 106 (3): 669–82. https://doi.org/10.2307/2937922.
Malz, Allan M. 1997. “Estimating the Probability Distribution of the Future Exchange Rate from Option Prices.” Journal of Derivatives 5

Latest
Most Popular
- VoxChina Covid-19 Forum (Second Edition): China’s Post-Lockdown Economic Recovery VoxChina, Apr 18, 2020
- China’s Great Housing Boom Kaiji Chen, Yi Wen, Oct 11, 2017
- China’s Joint Venture Policy and the International Transfer of Technology Kun Jiang, Wolfgang Keller, Larry D. Qiu, William Ridley, Feb 06, 2019
- The Dark Side of the Chinese Fiscal Stimulus: Evidence from Local Government Debt Yi Huang, Marco Pagano, Ugo Panizza, Jun 28, 2017
- Wealth Redistribution in the Chinese Stock Market: the Role of Bubbles and Crashes Li An, Jiangze Bian, Dong Lou, Donghui Shi, Jul 01, 2020
- Evaluating Risk across Chinese Housing Markets Yongheng Deng, Joseph Gyourko, Jing Wu, Aug 02, 2017
- What Is Special about China’s Housing Boom? Edward L. Glaeser, Wei Huang, Yueran Ma, Andrei Shleifer, Jun 20, 2017
- Privatization and Productivity in China Yuyu Chen, Mitsuru Igami, Masayuki Sawada, Mo Xiao, Jan 31, 2018
- Daily Price Limits and the Magnet Effect Ting Chen, Zhenyu Gao, Jibao He, Wenxi Jiang, Wei Xiong, Oct 25, 2017
- How did China Move Up the Global Value Chains? Hiau Looi Kee, Heiwai Tang, Aug 30, 2017


