A Bridge on Economic Issues between China and the World


 Facebook
  Twitter
  Instagram
 WeChat
  Email
Email Household Finance in China

We study household financial choices in China and compare them with those in the US. We estimate a structural model where the two countries differ in terms of preferences and institutional arrangements. In the structural estimation, we take into account the effects of important structural changes in the Chinese economy between 1990-2000.
Compared with US households, Chinese households save more and have a higher mean wealth-to-income ratio, participate less in the stock market, and have a lower stock share in total wealth for stock market participants, as shown in Table 1, calculated from the 2011 China Household Finance Survey (CHFS). What are the main factors influencing household financial choices in China? This paper shows the quantitative importance of the following four factors: (i) household preferences; (ii) labor market conditions; (iii) financial market conditions; and (iv) major structural change in the Chinese economy.
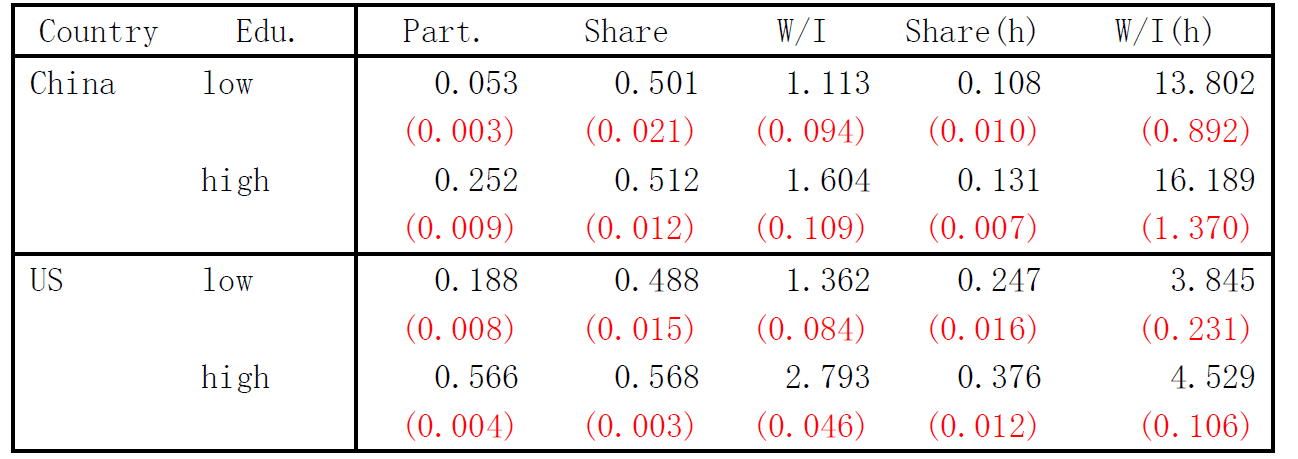
Notes: This table reports the participation rate, the share of stocks in household portfolio (for participants), the mean wealth-to-income ratio (W/I) for Chinese and US households by educational attainment. Data for China are from the CHFS (2011). Data for the US are from the SCF (1989-2007). Households whose heads have at least a high school diploma are defined as high education households. In calculating share(h) and W/I(h) housing equity is included in wealth.
Existing studies mainly focus on one aspect of household finance in China (e.g., the high savings rate). Important examples include Chamon and Prasad (2010), Wei and Zhang (2011), Chamon, Liu, and Prasad (2013), and Choukhmane, Coeurdacier, and Jin (2013). Our paper goes beyond this traditional focus by studying savings, stock market participation and portfolio composition in a household's lifetime optimization model. We estimate a structural model to understand some important features in the context of a US-China comparison.
One challenge we overcome is the identification of the effects of multiple structural changes during the 1990-2000 period in the Chinese economy, such as the opening of the stock market, labor market reform, and housing market reform, on household finance patterns. We do this by simulating different cohorts of households whose optimal saving and portfolio decisions depend on the timing of structural changes. Counterfactual analysis reveals that the structural changes in labor income processes and housing reform have large impacts. Had households in the 2011 CHFS not experienced the earlier labor market conditions with low income uncertainty, their wealth-to-income ratio would be about 20% higher, and the stock market participation rate would almost double. Without the privatization of the housing market and the ensuing home price run-ups, the wealth-to-income ratio would be 25% lower on average. Overall, we predict that, compared with households who experienced the aforementioned structural changes, the younger generation will save even more, have much higher participation rates in the stock market, and have higher stock share in total wealth.
Structural estimation results reveal significantly different parameters for China and the US. As shown in Table 2, Chinese households are much more patient (larger discount factors) and more willing to substitute consumption over time (a larger elasticity of inter-temporal substitution). The table also shows that stock market participation cost and adjustment in China are higher than in the US. The consumption floor, a parameter that captures the development of social safety nets, is much smaller in China compared with the US, according to our estimation. The small consumption floor, along with a high degree of income uncertainty (relative to the US), causes Chinese households to save more and take less risk in the stock market.
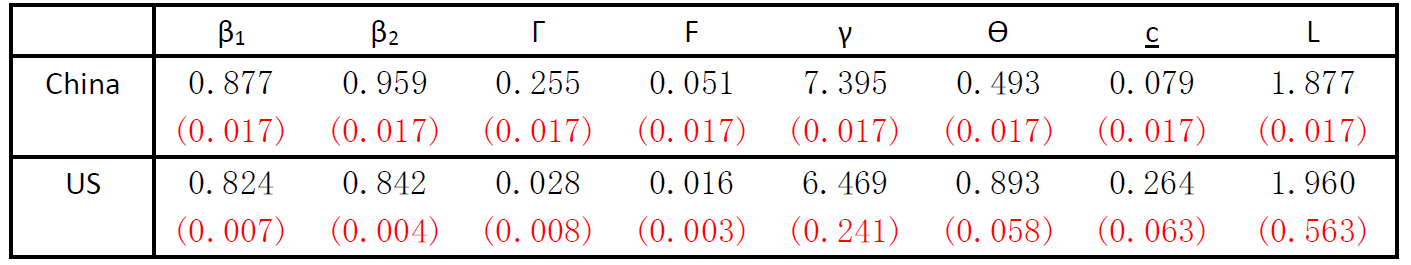
Notes: This table reports estimated parameter values and standard errors (in parentheses) for China and the US. βi for i = 1,2 refers to the discount factors of low and high education groups. Г and F are stock market entry and adjustment cost, respectively. γ is the relative risk aversion, ϴ is the inter-temporal elasticity of substitution, c is the consumption floor, and L is the strength of bequest motives.
We take two steps to understand the large difference between China and the US in household finance patterns. First, we impose US parameters on China one at a time, which highlights the relative importance of a particular parameter. Second, we group the parameters into three categories that are related to preferences, the financial market, and the labor market. We then conduct experiments where households with one country’s characteristics invest in another country.
Table 3 shows the results of imposing the US discount factors (β's), stock market entry cost (Г), stock market adjustment cost (F), consumption floor (c), and stock return process on China. If Chinese households were as impatient as US households (imposing US β), they would save much less, leading to an even lower stock market participation rate and stock share in wealth, hence widening the gap between the two countries in terms of household finance patterns. If Chinese households faced a stock market entry cost as low as in the US, they would participate in the stock market more than what is observed in the US market, again widening the gap between the two countries. Imposing the US stock market adjustment cost on China brings the participation rate in China close to that in the US. Imposing the relatively better developed US consumption floor on China causes Chinese households to save less and, therefore, participate even less in the stock market. Finally, imposing the US stock return on China brings household finance patterns in China closest to the US data, because the US market features lower volatility and a higher Sharpe ratio which make stock investment more attractive.
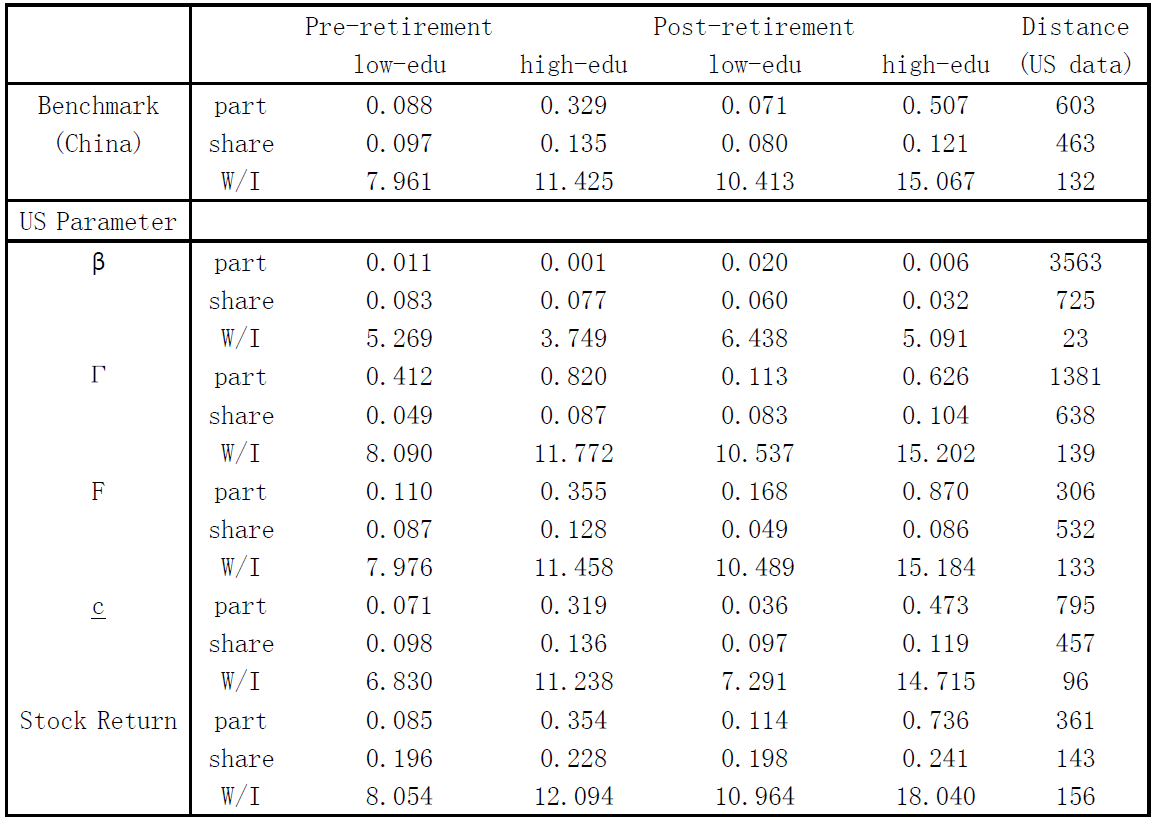
Notes: This table reports counterfactuals from imposing US parameters (one at a time) on the Chinese model, controlling for cohort effects. The China benchmark is simulated from the post structural change regime using parameters from the baseline model. The US data moments are taken from the SCF data between 1989-2007. The last column reports the distance between the simulated moments in China and US data moments.
Table 4 shows the results of experiments where either the Chinese invest in the US market or the Americans invest in the Chinese market. In the counterfactual experiment where Chinese households work in the Chinese labor market but invest in the US financial market, they have a wealth-to-income ratio even higher than observed in the Chinese data, reaching 9.6 times that of US households, and their average stock market participation rate exceeds 80%. If these Chinese households also work in the US labor market (i.e., are exposed to less income risks and protected by a higher consumption floor), their wealth-to-income ratio would fall from 9.6 times the size of US households to about 3 times, but stock share in total wealth would rise significantly.
For households with the US preferences that work and invest in China, their stock market participation rate is near zero, and their wealth-to-income ratio is only 30% of their Chinese counterparts. Further, if these US households are in the US labor market, but only invest in the Chinese financial market, none of them participate in the stock market. These experiments show that preferences play a significant role in the between-country differences, but conditions in either the labor market or the financial market are also quantitatively important.
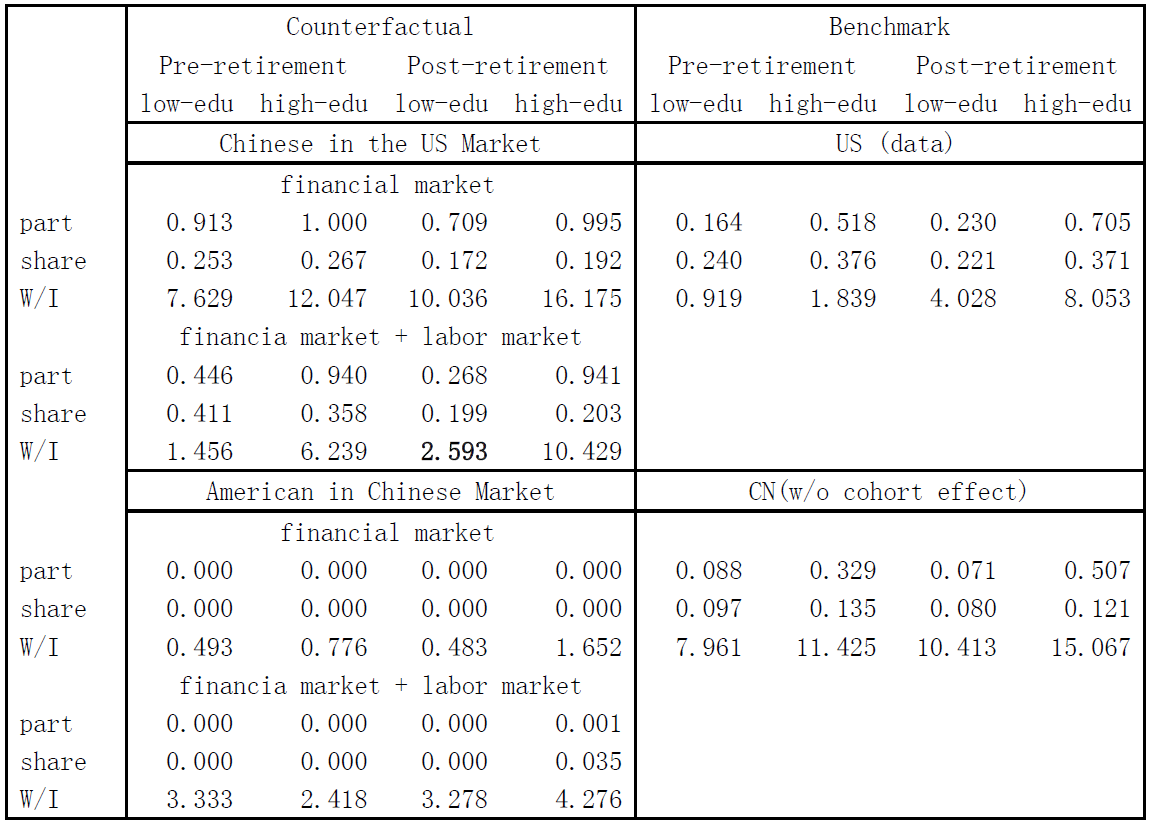
Notes: This table reports four counterfactuals experiments (the left panels) and the benchmarks (the right panels). A Chinese is defined as a household with the preference parameters estimated from the Chinese model, including discount factors (β’s), risk aversion (γ), EIS (θ), and bequest motive (L). An American is similarly defined. The financial market of a country is characterized by its stock market entry cost (Γ), stock adjustment cost (F), return on bond, and the stochastic process of stock return. The labor market of a country is characterized by its consumption floor (c), income processes, and medical expense processes.
In conclusion, we study multiple patterns of Chinese household finance, including participation in the stock market, stock share in total wealth, and wealth-to-income ratio, by estimating and simulating a lifecycle optimization model. One key point of the analysis is that we show that the major regime changes in the labor market and financial market in China have significantly impacted household finance patterns observed in the data. Ultimately it is important to understand the large disparity in household finance patterns between China and the US.
(Russell Cooper, Department of Economics, Pennsylvania State University; Guozhong Zhu, School of Business, University of Alberta.)
Chamon, M., K. Liu, and E. Prasad (2013), “Income Uncertainty and Household Savings in China,” Journal of Development Economics, 105(C), 164–177.
Chamon, M., and E. Prasad (2010), “Why Are Saving Rates of Urban Households in China Rising?,” American Economic Journal: Macroeconomics, 2(1), 93–130.
Choukhmane, T., N. Coeurdacier, and K. Jin (2013), “The One-Child Policy and Household Savings,” mimeo.
Russell, Cooper, and G. Zhu (2017), “Household Finance in China,” NBER Working Paper No.23741 http://www.nber.org/papers/w23741
Wei, Shangjin, and X. Zhang (2011), “The Competitive Saving Motive: Evidence from Rising Sex Ratios and Savings Rates in China,” Journal of Political Economy, 119(3), 511–564.
Compared with US households, Chinese households save more and have a higher mean wealth-to-income ratio, participate less in the stock market, and have a lower stock share in total wealth for stock market participants, as shown in Table 1, calculated from the 2011 China Household Finance Survey (CHFS). What are the main factors influencing household financial choices in China? This paper shows the quantitative importance of the following four factors: (i) household preferences; (ii) labor market conditions; (iii) financial market conditions; and (iv) major structural change in the Chinese economy.
Table 1: Household Finance Facts
Existing studies mainly focus on one aspect of household finance in China (e.g., the high savings rate). Important examples include Chamon and Prasad (2010), Wei and Zhang (2011), Chamon, Liu, and Prasad (2013), and Choukhmane, Coeurdacier, and Jin (2013). Our paper goes beyond this traditional focus by studying savings, stock market participation and portfolio composition in a household's lifetime optimization model. We estimate a structural model to understand some important features in the context of a US-China comparison.
One challenge we overcome is the identification of the effects of multiple structural changes during the 1990-2000 period in the Chinese economy, such as the opening of the stock market, labor market reform, and housing market reform, on household finance patterns. We do this by simulating different cohorts of households whose optimal saving and portfolio decisions depend on the timing of structural changes. Counterfactual analysis reveals that the structural changes in labor income processes and housing reform have large impacts. Had households in the 2011 CHFS not experienced the earlier labor market conditions with low income uncertainty, their wealth-to-income ratio would be about 20% higher, and the stock market participation rate would almost double. Without the privatization of the housing market and the ensuing home price run-ups, the wealth-to-income ratio would be 25% lower on average. Overall, we predict that, compared with households who experienced the aforementioned structural changes, the younger generation will save even more, have much higher participation rates in the stock market, and have higher stock share in total wealth.
Structural estimation results reveal significantly different parameters for China and the US. As shown in Table 2, Chinese households are much more patient (larger discount factors) and more willing to substitute consumption over time (a larger elasticity of inter-temporal substitution). The table also shows that stock market participation cost and adjustment in China are higher than in the US. The consumption floor, a parameter that captures the development of social safety nets, is much smaller in China compared with the US, according to our estimation. The small consumption floor, along with a high degree of income uncertainty (relative to the US), causes Chinese households to save more and take less risk in the stock market.
Table 2: Parameter Estimates
Notes: This table reports estimated parameter values and standard errors (in parentheses) for China and the US. βi for i = 1,2 refers to the discount factors of low and high education groups. Г and F are stock market entry and adjustment cost, respectively. γ is the relative risk aversion, ϴ is the inter-temporal elasticity of substitution, c is the consumption floor, and L is the strength of bequest motives.
We take two steps to understand the large difference between China and the US in household finance patterns. First, we impose US parameters on China one at a time, which highlights the relative importance of a particular parameter. Second, we group the parameters into three categories that are related to preferences, the financial market, and the labor market. We then conduct experiments where households with one country’s characteristics invest in another country.
Table 3 shows the results of imposing the US discount factors (β's), stock market entry cost (Г), stock market adjustment cost (F), consumption floor (c), and stock return process on China. If Chinese households were as impatient as US households (imposing US β), they would save much less, leading to an even lower stock market participation rate and stock share in wealth, hence widening the gap between the two countries in terms of household finance patterns. If Chinese households faced a stock market entry cost as low as in the US, they would participate in the stock market more than what is observed in the US market, again widening the gap between the two countries. Imposing the US stock market adjustment cost on China brings the participation rate in China close to that in the US. Imposing the relatively better developed US consumption floor on China causes Chinese households to save less and, therefore, participate even less in the stock market. Finally, imposing the US stock return on China brings household finance patterns in China closest to the US data, because the US market features lower volatility and a higher Sharpe ratio which make stock investment more attractive.
Table 3: US Parameters on Chinese Households
Table 4 shows the results of experiments where either the Chinese invest in the US market or the Americans invest in the Chinese market. In the counterfactual experiment where Chinese households work in the Chinese labor market but invest in the US financial market, they have a wealth-to-income ratio even higher than observed in the Chinese data, reaching 9.6 times that of US households, and their average stock market participation rate exceeds 80%. If these Chinese households also work in the US labor market (i.e., are exposed to less income risks and protected by a higher consumption floor), their wealth-to-income ratio would fall from 9.6 times the size of US households to about 3 times, but stock share in total wealth would rise significantly.
For households with the US preferences that work and invest in China, their stock market participation rate is near zero, and their wealth-to-income ratio is only 30% of their Chinese counterparts. Further, if these US households are in the US labor market, but only invest in the Chinese financial market, none of them participate in the stock market. These experiments show that preferences play a significant role in the between-country differences, but conditions in either the labor market or the financial market are also quantitatively important.
Table 4: Cross-country Counterfactuals
In conclusion, we study multiple patterns of Chinese household finance, including participation in the stock market, stock share in total wealth, and wealth-to-income ratio, by estimating and simulating a lifecycle optimization model. One key point of the analysis is that we show that the major regime changes in the labor market and financial market in China have significantly impacted household finance patterns observed in the data. Ultimately it is important to understand the large disparity in household finance patterns between China and the US.
(Russell Cooper, Department of Economics, Pennsylvania State University; Guozhong Zhu, School of Business, University of Alberta.)
Chamon, M., K. Liu, and E. Prasad (2013), “Income Uncertainty and Household Savings in China,” Journal of Development Economics, 105(C), 164–177.
Chamon, M., and E. Prasad (2010), “Why Are Saving Rates of Urban Households in China Rising?,” American Economic Journal: Macroeconomics, 2(1), 93–130.
Choukhmane, T., N. Coeurdacier, and K. Jin (2013), “The One-Child Policy and Household Savings,” mimeo.
Russell, Cooper, and G. Zhu (2017), “Household Finance in China,” NBER Working Paper No.23741 http://www.nber.org/papers/w23741
Wei, Shangjin, and X. Zhang (2011), “The Competitive Saving Motive: Evidence from Rising Sex Ratios and Savings Rates in China,” Journal of Political Economy, 119(3), 511–564.

Latest
Most Popular
- VoxChina Covid-19 Forum (Second Edition): China’s Post-Lockdown Economic Recovery VoxChina, Apr 18, 2020
- China’s Great Housing Boom Kaiji Chen, Yi Wen, Oct 11, 2017
- China’s Joint Venture Policy and the International Transfer of Technology Kun Jiang, Wolfgang Keller, Larry D. Qiu, William Ridley, Feb 06, 2019
- The Dark Side of the Chinese Fiscal Stimulus: Evidence from Local Government Debt Yi Huang, Marco Pagano, Ugo Panizza, Jun 28, 2017
- Wealth Redistribution in the Chinese Stock Market: the Role of Bubbles and Crashes Li An, Jiangze Bian, Dong Lou, Donghui Shi, Jul 01, 2020
- Evaluating Risk across Chinese Housing Markets Yongheng Deng, Joseph Gyourko, Jing Wu, Aug 02, 2017
- What Is Special about China’s Housing Boom? Edward L. Glaeser, Wei Huang, Yueran Ma, Andrei Shleifer, Jun 20, 2017
- Privatization and Productivity in China Yuyu Chen, Mitsuru Igami, Masayuki Sawada, Mo Xiao, Jan 31, 2018
- Daily Price Limits and the Magnet Effect Ting Chen, Zhenyu Gao, Jibao He, Wenxi Jiang, Wei Xiong, Oct 25, 2017
- How did China Move Up the Global Value Chains? Hiau Looi Kee, Heiwai Tang, Aug 30, 2017


