A Bridge on Economic Issues between China and the World


 Facebook
  Twitter
  Instagram
 WeChat
  Email
Email China’s New Nationwide CO2 Emissions Trading System: General Equilibrium Impacts
China’s recently launched CO2 emissions trading system, already the world’s largest, aims to contribute importantly toward global reductions in greenhouse gas emissions. We have developed a multi-sector, multi-period general equilibrium model to assess this new venture, a model that uniquely considers institutional and fiscal features of China’s economy that influence economy-wide policy costs and distributional impacts. Findings include: the TPS’s environmental benefits significantly exceed its costs, interactions with China’s fiscal system substantially affect its costs relative to cap and trade (the principal emissions trading approach of other countries), and improving the evenness of cost impacts across provinces comes at a significant aggregate cost.

In 2021, China launched a nationwide emissions trading system (ETS) to reduce emissions of carbon dioxide (CO2). It is expected to make a major contribution toward achieving a CO2 emissions peak by 2030 and carbon neutrality by 2060. An important feature of China’s nationwide ETS is that it is a tradable performance standard (TPS), a rate-based system under which each covered facility receives from the government in each compliance period a certain number of emissions allowances based on its output and the government’s assigned “benchmark” ratio of emissions per unit of output.
Facilities covered under this system may trade emissions allowances. In this respect, the TPS shares a key feature of cap and trade (C&T), the principal type of emissions trading program used in other countries. However, a TPS differs from C&T in important ways. Under C&T, a covered facility’s compliance is based on the absolute quantity of its emissions. In contrast, under the TPS’s rate-based approach, the number of allowances granted to a covered facility is a function of the facility’s output: an additional unit of output earns the facility additional allowances, which are valuable to the facility. The endogeneity of the allowance allocation has important implications for the overall cost and distributional impacts of the policy.
The TPS creates an implicit subsidy for an increase in a covered facility’s output. Although there is a significant existing literature on China’s ETS, only a few prior studies recognize the unique incentives created by this rate-based design (Zhang, Zhang, and Zhang 2023; Wang, Pizer, and Munnings 2022; Goulder et al. 2022; Yu et al. 2022). Generally, the TPS is considered more viable for China as a developing country whose emissions have not yet peaked because it does not impose an absolute cap on total emissions (Pizer and Zhang 2018, Karplus and Zhang 2017). However, most previous studies argued that the TPS is less cost-effective than a C&T system (Fischer 2001, Goulder et al. 2022, Yu et al. 2022). The disadvantage in cost-effectiveness has been attributed to the TPS’s implicit output subsidy, which restricts the extent to which firms will adopt output-reduction as a channel for reducing emissions.
In our recent study (Goulder et al. 2023), we add new insights to the discussions of the cost-effectiveness of China’s TPS. The findings are based on a multiperiod general equilibrium model with several distinguishing features that help identify important economic forces and outcomes that have previously received little recognition. The model pays close attention to the structure and compliance obligations of China’s TPS. For example, in the electricity sector in China, the government has implemented four different benchmarks for different technological categories, a characteristic ignored by previous models. Incorporating this feature requires modeling production heterogeneity within a single sector; we are able to address this heterogeneity by utilizing unique firm-level datasets. Additionally, our model considers how institutional and regulatory features of China’s economy influence the outcomes of the TPS and C&T, features that influence the TPS’s costs and the differences between its costs and those of C&T.
Aggregate Impacts of China’s TPS
We examine the TPS’s impacts in its three planned phases. Phase 1 began in 2020 and covered only the electricity sector (which accounted for about 43% of China’s total CO2 emissions in 2020). Phase 2 will expand coverage to include the aluminum, cement, and iron and steel sectors, which currently account for about 67% of China’s CO2 emissions. Phase 3 is expected to begin in 2026, with coverage expanding further to include all emission-intensive industries and cover around 70% of China’s CO2 emissions.
As indicated in Figure 1, the reductions in CO2 emissions become larger as the system’s coverage expands and the benchmarks are tightened. At the beginning of Phase 3, the emissions reduction (relative to the baseline path) is about 6%. By 2035 (the end of Phase 3), the estimated emissions reduction is about 20% relative to the baseline.
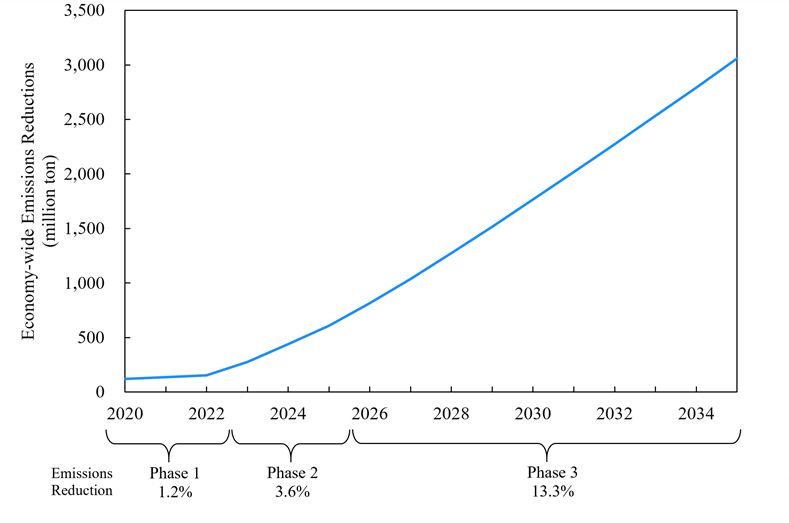
Numbers in italics are percentage emissions reductions from the baseline
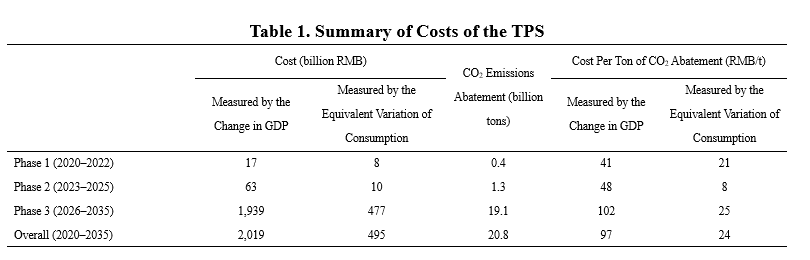
Table 1 summarizes the estimated cost of the TPS under central case values of the model’s parameters. The GDP cost in Phase 1 is relatively small—less than 0.01%—but costs expand significantly over time, a consequence of increased benchmark stringency and broader sector coverage. The present value of the GDP cost over the period 2020–2035 is 0.13% of the baseline GDP.
Net Benefits
One important consideration in evaluating any climate policy is whether the benefits from reduced emissions exceed the policy’s cost. Figure 2a shows the ranges and the central estimates of costs and climate benefits under the TPS. The climate benefits are the avoided climate damages (or avoided “social cost of carbon”), as expressed by the Biden administration and several recent studies. Under plausible ranges of model parameters, the estimated benefits from the cumulative CO2 reductions over the 2020–2035 interval are in the range of 6-43 trillion RMB, 3-22 times the cumulative costs. The central estimate of the climate benefit is 10 trillion RMB, around five times the TPS’s costs.
Figure 2b displays the costs and benefits when health benefits from reduced local pollution are accounted for. Accounting for health benefits raises the benefit-cost ratio substantially. The central estimate is that the TPS could avoid 2.3–2.5 million PM2.5-related deaths in total over the 2020–2035 interval, relative to the baseline. Under plausible ranges of model parameters, the present value of the TPS’s climate and health benefits ranges 19–122 trillion RMB over the 2020–2035 interval. The central estimate is 53 trillion RMB, 26 times the central estimate for the TPS’s costs.
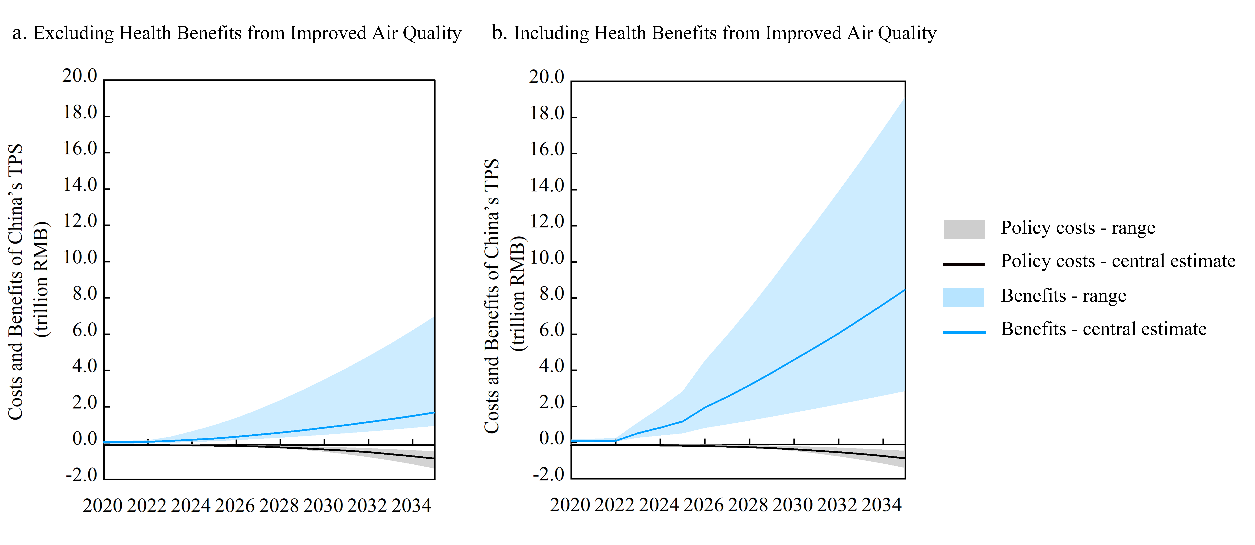
Figure 2. Costs and Benefits of China’s TPS
Switching from the TPS to C&T
An important policy choice for China’s policymakers on emissions trading is whether to maintain the TPS or switch to a C&T. Our study offers insights on this issue by revealing important factors that determine the relative costs of the two policies.
Figures 3a and 3b display the economic costs and allowance prices of the TPS and a C&T that achieves the same emissions reduction. Figure 3a reveals that the relative costs of the TPS and C&T follow a dynamic pattern. The TPS’s costs are close to those of C&T during the first two phases of the program but rise above the C&T costs in later years.
Three factors underlie this pattern. First, as was noted previously, the TPS introduces an implicit subsidy to output, which causes covered facilities to make relatively inefficient use of the output-reduction channel to reduce emissions (see Figure 4). Therefore, the output level of the TPS is higher than the equally stringent C&T, leading to higher demand for allowances and thus higher allowance prices (see Figure 3b).
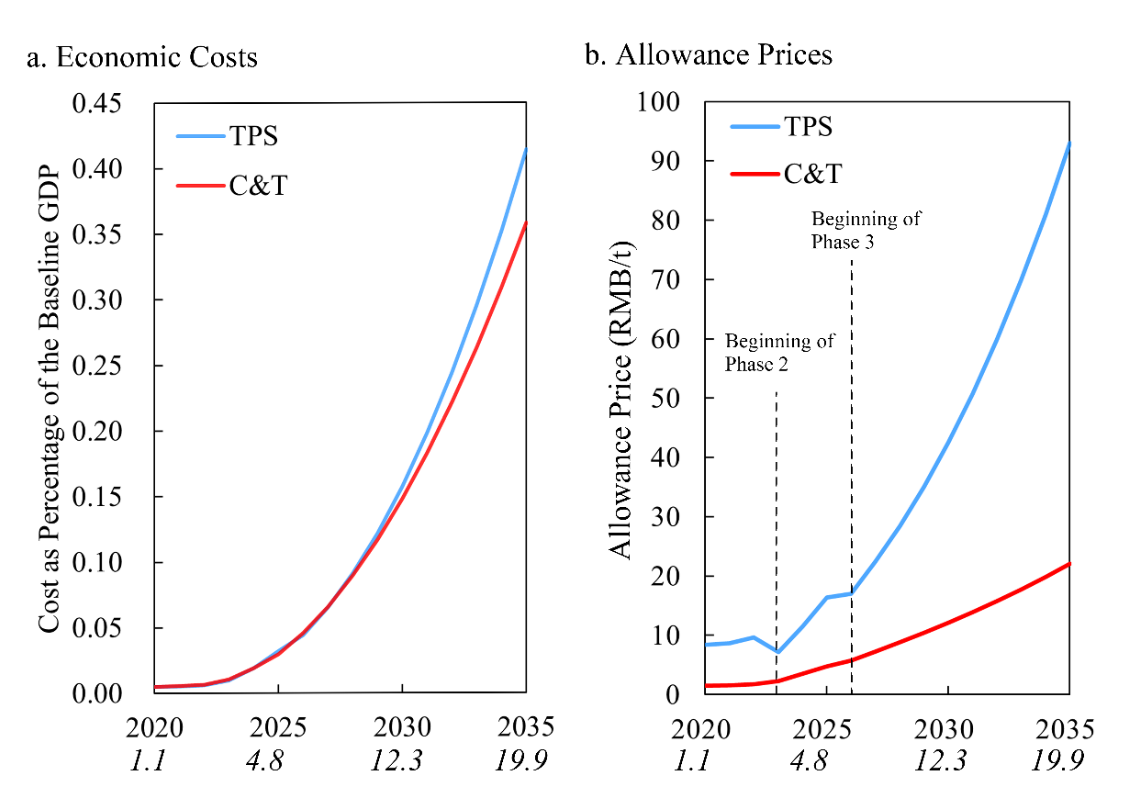
Figure 3. Carbon Price and Economic Costs Over Time
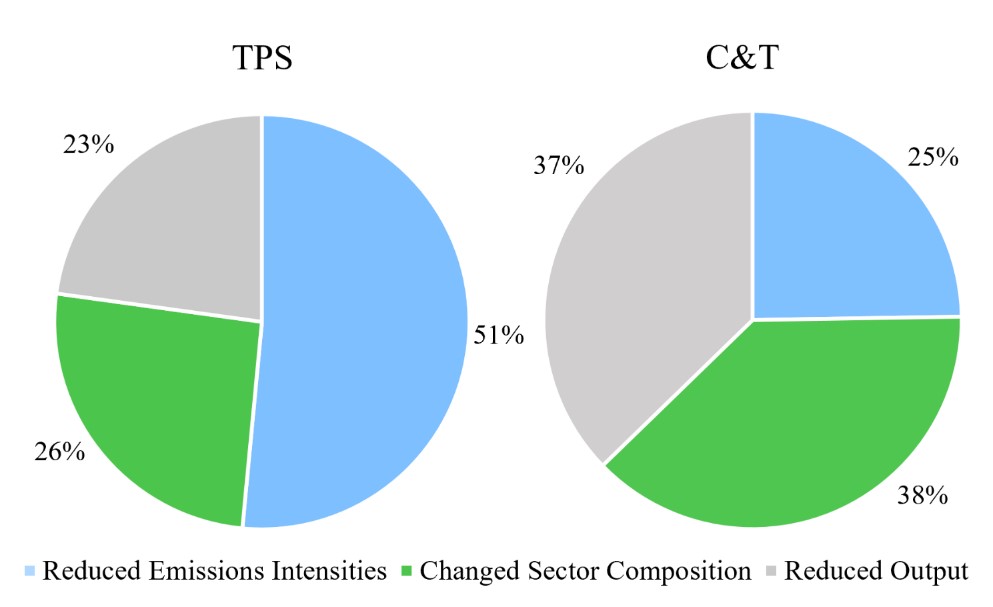
Figure 4. Sources of Emissions Reduction Under the TPS and C&T, 2020–2035
Two other previously unrecognized factors underline this pattern. One is policy stringency, which explains the widening gap between the policies’ costs over time. The inefficiency associated with the TPS’s implicit subsidy is proportional to the product of the benchmark and the allowance price. Greater stringency generally implies a higher allowance price, which augments the importance of the implicit subsidy.
A further and important additional factor is the presence of taxes on factors of production. Although the TPS’s implicit output subsidy leads to inefficiently small output reductions relative to C&T, it also has the beneficial effect (in terms of efficiency) of reducing the distortionary effect of pre-existing taxes and renewable subsidies when its stringency level is low. This beneficial impact offsets the cost-effectiveness disadvantage of TPS. As Figure 3b shows, in the initial years of the TPS, the opposing effects on cost-effectiveness are comparable, resulting in similar costs of the two policies. However, over time, as the stringency increases, the adverse impact from the implicit subsidy becomes more significant than the beneficial impact of pre-existing taxes and the gap between the TPS and C&T costs widens.
Trade-offs between Efficiency and Fairness
China’s policymakers aim to achieve cost-effective emissions reductions while ensuring fairness across sectors, regions, and demographics. However, these objectives can be in conflict.
Figure 5 displays the economic costs in cases that differ in terms of variation of benchmarks. During the interval 2020–2035, employing a single benchmark for the electricity sector would lower costs by 34% relative to the four-benchmark system that is in place. Greater uniformity lowers the aggregate cost by reducing the variation in the implicit subsidy and associated wedge between the consumer price and the marginal cost of production. This leads to a more efficient allocation of production across generators.
Multiple benchmarks can serve distributional objectives, however. The percentage losses of provincial income are much more unevenly distributed in the one-benchmark case than in the four-benchmark case, which provides less stringent benchmarks to provinces especially reliant on high-carbon-intensity electricity generation under the baseline. The standard deviation of percentage income losses across provinces is more than 60% higher in the one-benchmark case than in the four-benchmark case.
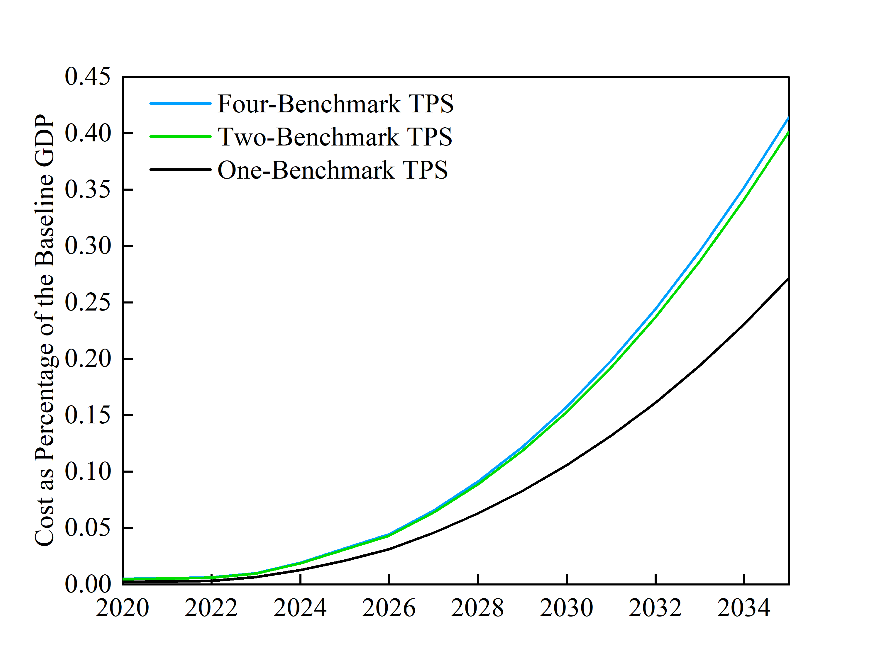
Figure 5. Economic Cost as a Function of Number (and Variation) of Benchmarks
To summarize, our new study offers a dynamic general equilibrium assessment of China’s nationwide ETS by employing a model that uniquely considers institutional and fiscal features of China’s economy. Findings include: the TPS’s environmental benefits significantly exceed its costs, interactions with China’s fiscal system substantially affect its costs relative to C&T, and improving the evenness of cost-impacts across provinces comes at a significant aggregate cost. We hope that these findings and future results from our research will be useful to China’s decision-makers as they continue to make important climate policy decisions.
References
Carleton, Tamma, and Michael Greenstone. 2022. “A Guide to Updating the US Government’s Social Cost of Carbon.” Review of Environmental Economics and Policy 16 (2): 196–218. https://doi.org/10.1086/720988.
Fischer, Carolyn. 2001. “Rebating Environmental Policy Revenues: Output-Based Allocations and Tradable Performance Standards.” Resources for the Future Discussion Paper 01–22. https://media.rff.org/documents/RFF-DP-01-22.pdf.
Goulder, Lawrence H., Xianling Long, Chenfei Qu, and Da Zhang. 2023. “China’s Nationwide CO2 Emissions Trading System: A General Equilibrium Assessment.” National Bureau of Economic Research Working Paper No. 31809. https://doi.org/10.3386/w31809.
Goulder, Lawrence H., Xianling Long, Jieyi Lu, and Richard D. Morgenstern. 2022. “China’s Unconventional Nationwide CO2 Emissions Trading System: Cost-Effectiveness and Distributional Impacts.” Journal of Environmental Economics and Management 111 (January): 102561. https://doi.org/10.1016/j.jeem.2021.102561.
Karplus, Valerie J., and Xiliang Zhang. 2017. “Incentivizing Firm Compliance with China’s National Emissions Trading System.” Economics of Energy and Environmental Policy 6 (2): 73–86. https://www.jstor.org/stable/26189179.
Pizer, William A., and Xiliang Zhang. 2018. “China’s New National Carbon Market.” AEA Papers and Proceedings 108 (May): 463–67. https://doi.org/10.1257/pandp.20181029.
Rennert, Kevin, Frank Errickson, Brian C. Prest, Lisa Rennels, Richard G. Newell, William Pizer, Cora Kingdon, Jordan Wingenroth, Roger Cooke, Bryan Parthum, David Smith, Kevin Cromar, Delavane Diaz, Frances C. Moore, Ulrich K. Müller, Richard J. Plevin, Adrian E. Raftery, Hana Ševčíková, Hannah Sheets, James H. Stock, Tammy Tan, Mark Watson, Tony E. Wong, and David Anthoff. 2022. “Comprehensive Evidence Implies a Higher Social Cost of CO2.” Nature 610: 687–92. https://doi.org/10.1038/s41586-022-05224-9.
Wang, Banban, William A. Pizer, and Clayton Munnings. 2022. “Price Limits in a Tradable Performance Standard.” Journal of Environmental Economics and Management 116: 102742. https://doi.org/10.1016/j.jeem.2022.102742.
Yu, Zhongjue, Yong Geng, Alvaro Calzadilla, and Raimund Bleischwitz. 2022. “China’s Unconventional Carbon Emissions Trading Market: The Impact of a Rate-Based Cap in the Power Generation Sector.” Energy 255: 124581. https://doi.org/10.1016/j.energy.2022.124581.
Zhang, Hongyu, Da Zhang, and Xiliang Zhang. 2023. “The Role of Output-Based Emission Trading System in the Decarbonization of China’s Power Sector.” Renewable and Sustainable Energy Reviews 173: 113080. https://doi.org/10.1016/j.rser.2022.113080.

Latest
Most Popular
- VoxChina Covid-19 Forum (Second Edition): China’s Post-Lockdown Economic Recovery VoxChina, Apr 18, 2020
- China’s Great Housing Boom Kaiji Chen, Yi Wen, Oct 11, 2017
- China’s Joint Venture Policy and the International Transfer of Technology Kun Jiang, Wolfgang Keller, Larry D. Qiu, William Ridley, Feb 06, 2019
- The Dark Side of the Chinese Fiscal Stimulus: Evidence from Local Government Debt Yi Huang, Marco Pagano, Ugo Panizza, Jun 28, 2017
- Wealth Redistribution in the Chinese Stock Market: the Role of Bubbles and Crashes Li An, Jiangze Bian, Dong Lou, Donghui Shi, Jul 01, 2020
- Evaluating Risk across Chinese Housing Markets Yongheng Deng, Joseph Gyourko, Jing Wu, Aug 02, 2017
- What Is Special about China’s Housing Boom? Edward L. Glaeser, Wei Huang, Yueran Ma, Andrei Shleifer, Jun 20, 2017
- Privatization and Productivity in China Yuyu Chen, Mitsuru Igami, Masayuki Sawada, Mo Xiao, Jan 31, 2018
- Daily Price Limits and the Magnet Effect Ting Chen, Zhenyu Gao, Jibao He, Wenxi Jiang, Wei Xiong, Oct 25, 2017
- How did China Move Up the Global Value Chains? Hiau Looi Kee, Heiwai Tang, Aug 30, 2017


