A Bridge on Economic Issues between China and the World


 Facebook
  Twitter
  Instagram
 WeChat
  Email
Email Employee Output Response to Stock Market Wealth Shocks
Exploiting individual-level data linking worker performance and stock investment, we show that a 10% increase in stock investment returns is associated with a decrease in the same investor’s work output by 3.8% in the following month. Consistent with the reference dependence interpretation, the response is short-lived and the effect is stronger when the total income has reached a reference income. Our results highlight a novel channel of transmitting stock market fluctuation through labor supply.

Stock holdings constitute a considerable portion of a household’s financial assets. For example, in the last quarter of 2019, direct and indirect stock holdings of US households accounted for 36% of their financial assets. Moreover, households are the largest holders of US equities, with a total holding of $34.2 trillion, comprising over 90% of the market capitalization (Federal Reserve 2020). The direct and indirect stock holdings of Chinese urban households represented around 10% of their financial assets in 2019, equivalent to an average of 64,000 RMB per household (People’s Bank of China 2020), and stock market wealth is estimated to take around 4% of the income expected in an average Chinese investor’s remaining work life. These facts have two implications. First, fluctuations in the stock market have a significant impact on household wealth accumulation (Poterba 2000). Second, the household sector is an important transmission channel from the stock market to the real economy, whereby changes in stock market wealth either directly affect aggregate tax revenues or indirectly reshape households’ real decision making, such as consumption. Given this importance, asset prices have been frequently considered a factor in setting monetary policies (Greenspan 1999).
In Li, Qian, Xiong, and Zou (2022), we study labor supply response to changes in stock market wealth at the individual level. Household consumption consists of both market goods and leisure. After an increase in stock market wealth, households enjoy more leisure by choosing to supply less labor. Incorporating the leisure response thus not only enables a more comprehensive understanding of the household response to changes in stock market wealth, but also carries important implications for the labor market. The nature of the labor supply response is less straightforward. The standard model of lifecycle labor supply predicts that individuals typically spread out leisure (earnings) response following a wealth shock over time. However, the effect of high-frequency changes in the stock market wealth on households’ labor decisions, which often adjust at a lower frequency, remains unclear. In particular, the labor supply response hinges on how investors perceive frequent shocks to stock market wealth. When individuals have a short-term mental account, the reference dependence theory suggests that they will reduce their labor supply over a short horizon when their income has reached a reference point.
Valid identification of causal effect requires granular data that allow us to track individual variations in the stock market wealth together with labor supply behavior so we can reasonably attribute the labor supply response to the same individual’s recent stock market wealth fluctuation. To directly examine the impact of changes in stock market wealth on labor supply, we exploit a novel micro-level dataset that links information on individuals’ work performance and their direct stock market investments and wealth at the monthly frequency. We obtain the monthly work income of over 17,000 insurance sales agents from a leading Chinese life insurance company’s major city branch during 2013–2016. Specifically, we focus on sales commission income in the analysis because insurance sales agents are paid a fixed rate for each insurance policy sold. As a result, sales commissions, which vary month by month, directly track concurrent work output and labor supply.
We then link each sales agent in our sample to their entire stock investment activities for stocks listed on the Shenzhen Stock Exchange—one of the two major stock exchanges in China—during the four-year period. For each investor, we obtain stock account information at the security-month level, whereby we observe the month-end value of each stock held, as well as the dollar value and shares bought and sold for each stock in each month. Collectively, the final linked dataset allows us to track the individual-specific stock market investments and the same individual’s labor output at the monthly frequency.
To provide an identified estimate, we run individual-level regressions of insurance sales commission on stock investment returns in the last month among the employee investors, controlling for individual and year-month fixed effects. We find that a 10% increase in monthly stock investment returns is associated with a 3.8% decrease in insurance sales commission in the subsequent month, and the effect is statistically significant and economically meaningful (Table 1). In addition, the impact is larger when the stock investment returns are higher relative to the baseline work income.
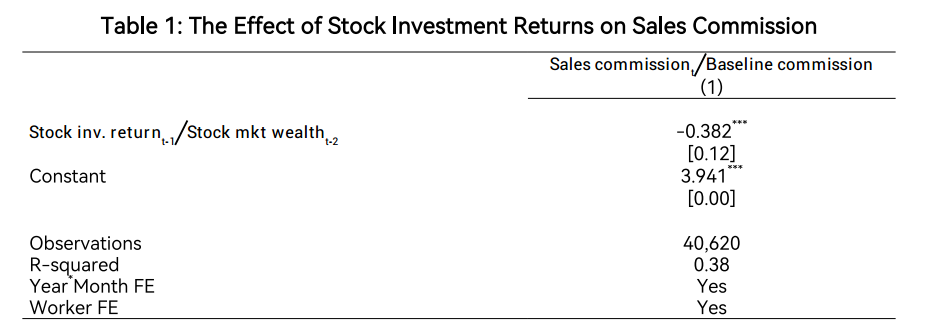
Notes: This table reports the average effect of last-month scaled stock investment returns on the current-month scaled sales commission. Sales commission is the monthly commission income from current-month insurance product sales (in RMB). Baseline commission is the average monthly sales commission before the individual’s first stock investment return in the sample, or the first positive sales commission if all sales commissions before the first stock investment return are 0. Stock inv. return is the monthly dollar value of stock investment returns (in RMB). 〖Stock inv. return〗_t=〖holding value〗_t-〖holding value〗_(t-1)+〖sell value〗_t-〖buy value〗_t, where the 〖sell value〗_t is the total dollar value of stocks sold in month t, and 〖buy value〗_t is the total dollar value of stocks bought in month t. Stock mkt wealth is the stock market wealth for an individual, proxied by the stock holdings at the end of the corresponding month. Months used to calculate the baseline commissions are excluded from the regressions. Individual and year-month fixed effects are included. Standard errors clustered at the individual and year-month level are reported in brackets. ***, **, and * indicate significance at 1%, 5%, and 10%, respectively.
A natural alternative interpretation of the main results stems from concurrent macro and local economic conditions that affect both stock investment returns and labor output. While the fixed effects in our regression control for the macro trend, they do not fully absorb the confounding economic factors that vary at a more local level. In addition, a booming local economy may also influence insurance policy sales due to better labor market opportunities elsewhere. A booming stock market may also shift customer’s demand toward direct stock market investments and away from insurance products, which also offer savings. In these cases, a negative response in insurance policy sales need not suggest a decrease in labor supply.
We directly address the identification concerns in several ways. First, we randomly assign the investor workers’ monthly stock investment returns to either a non-investor or an investor working at the same sub-branch, where they share economic fundamentals at the very local level and face the same group of potential insurance customers, and document close to zero empirical relationship. In addition, we extract variation in the individual stock investment returns that is plausibly idiosyncratic (and hence uncontaminated by local economic conditions), including restricting our analysis to the stock investment returns of non-local stocks or investigating the relationship among investors with low investment skills, and continue to find negative and significant labor output response. Moreover, the concern of individual-specific time-varying circumstances that influence the decision to access stock market wealth and supply labor is mitigated, given that we find the negative labor output response to total stock investment returns remains unchanged after controlling for realized gains, and the output response remains significant during months with lower liquidity needs.
We then explore the potential economic mechanisms to explain the negative relation between stock investment returns and subsequent labor output (Table 2). The standard lifecycle model suggests that individuals adjust their labor supply over time in response to income shocks, resulting in a persistent response (Imbens, Rubin, and Sacerdote 2001; Cesarini et al. 2017). However, we find a short-lived labor supply response as the sales commission is responsive only to the last-month stock investment returns. The temporal pattern of the labor output response is consistent with the reference dependence model’s prediction. In particular, individuals have a short-term mental account and will significantly reduce their labor supply over a short horizon when their income has reached the reference point (Camerer, et al. 1997, Farber 2008; Agarwal et al. 2015). We provide further evidence supportive of the reference dependence hypothesis by documenting a stronger negative response of sales commission when the total income in the last month has reached a reference income.
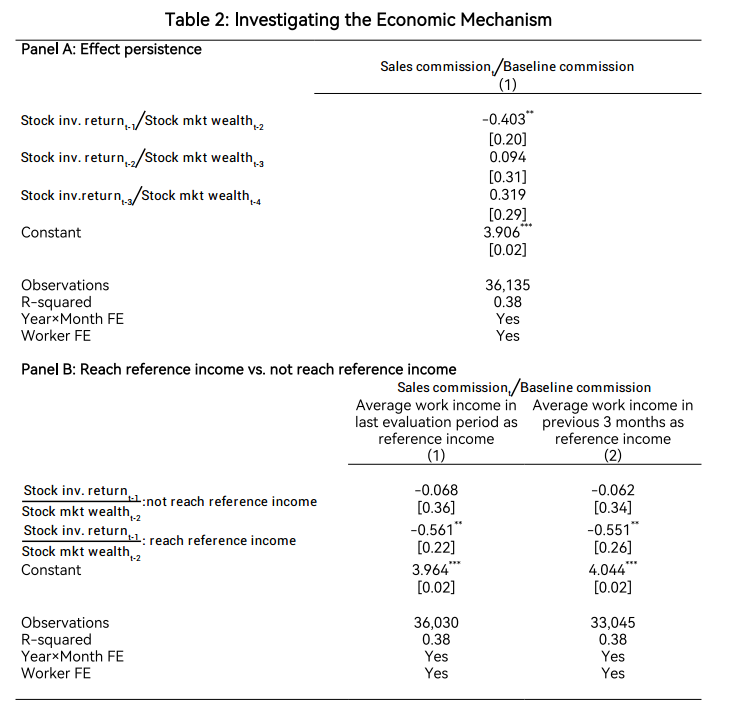
Notes: Panel A investigates the effect of scaled stock investment returns in the past three months on scaled sales commission. Panel B investigates the effect of last month scaled stock investment returns on scaled sales commission when the total income (defined as the sum of total work income and stock investment return) has reached the reference point versus not reached the reference point separately in last month. Column (1) defines the reference income for each month as the average total work income in the last performance evaluation period (i.e., average total work income during January to March as target income from April to June of calendar year y). Column (2) defines the reference income for each month as the average total work income in the past three months rolling window. Refer to Table 1 notes for detailed variable definitions. Months used to calculate the baseline commissions are excluded from the regressions. Individual and year-month fixed effects are included. Standard errors clustered at the individual and year-month level are reported in brackets. ***, **, and * indicate significance at 1%, 5%, and 10%, respectively.
Overall, our results highlight a novel channel of transmitting stock market fluctuations to the real economy through labor supply.
References
Agarwal, Sumit, Mi Diao, Jessica Pan, and Tien Foo Sing. 2015. “Are Singaporean Cabdrivers Target Earners?” https://dx.doi.org/10.2139/ssrn.2338476.
Camerer, Colin, Linda Babcock, George Loewenstein, and Richard Thaler. 1997. “Labor Supply of New York City Cabdrivers: One Day at a Time.” Quarterly Journal of Economics 112 (2): 407–41. https://doi.org/10.1162/003355397555244.
Cesarini, David, Erik Lindqvist, Matthew J. Notowidigdo, and Robert Östling. 2017. “The Effect of Wealth on Individual and Household Labor Supply: Evidence from Swedish Lotteries.” American Economic Review 107 (12): 3917–46. https://doi.org/10.1257/aer.20151589.
Farber, Henry S. 2008. “Reference-Dependent Preferences and Labor Supply: The Case of New York City Taxi Drivers.” American Economic Review 98 (3): 1069–82. https://doi.org/10.1257/aer.98.3.1069.
Imbens, Guido W., Donald B. Rubin, and Bruce I. Sacerdote. 2001. “Estimating the Effect of Unearned Income on Labor Earnings, Savings, and Consumption: Evidence from a Survey of Lottery Players.” American Economic Review 91 (4): 778–94. https://doi.org/10.1257/aer.91.4.778.
Li, Teng, Wenlan Qian, Wei A. Xiong, and Xin Zou. 2022. “Employee Output Response to Stock Market Wealth Shocks.” Journal of Financial Economics 146 (2): 779–96. https://doi.org/10.1016/j.jfineco.2021.11.005.
Poterba, James M. 2000. “Stock Market Wealth and Consumption.” Journal of Economic Perspectives 14 (2): 99–118. https://doi.org/10.1257/jep.14.2.99.

Latest
Most Popular
- VoxChina Covid-19 Forum (Second Edition): China’s Post-Lockdown Economic Recovery VoxChina, Apr 18, 2020
- China’s Great Housing Boom Kaiji Chen, Yi Wen, Oct 11, 2017
- China’s Joint Venture Policy and the International Transfer of Technology Kun Jiang, Wolfgang Keller, Larry D. Qiu, William Ridley, Feb 06, 2019
- The Dark Side of the Chinese Fiscal Stimulus: Evidence from Local Government Debt Yi Huang, Marco Pagano, Ugo Panizza, Jun 28, 2017
- Wealth Redistribution in the Chinese Stock Market: the Role of Bubbles and Crashes Li An, Jiangze Bian, Dong Lou, Donghui Shi, Jul 01, 2020
- Evaluating Risk across Chinese Housing Markets Yongheng Deng, Joseph Gyourko, Jing Wu, Aug 02, 2017
- What Is Special about China’s Housing Boom? Edward L. Glaeser, Wei Huang, Yueran Ma, Andrei Shleifer, Jun 20, 2017
- Privatization and Productivity in China Yuyu Chen, Mitsuru Igami, Masayuki Sawada, Mo Xiao, Jan 31, 2018
- Daily Price Limits and the Magnet Effect Ting Chen, Zhenyu Gao, Jibao He, Wenxi Jiang, Wei Xiong, Oct 25, 2017
- How did China Move Up the Global Value Chains? Hiau Looi Kee, Heiwai Tang, Aug 30, 2017


