A Bridge on Economic Issues between China and the World


 Facebook
  Twitter
  Instagram
 WeChat
  Email
Email Regional Variation of GDP per Head within China, 1080–1850: Implications for the Great Divergence Debate
We provide the first regional breakdown of GDP per head for China from the Song dynasty to the Qing, so that regions of similar size can be compared between Europe and Asia to establish the timing of the Great Divergence of living standards. These data suggest that China was the leading economy in the world during the Song dynasty and that the Great Divergence began around 1700 as the leading region of China, the Yangzi Delta, fell decisively behind the leading region of Europe.

T he Great Divergence debate has highlighted the need to compare regions
of similar size in Europe and Asia (Pomeranz 2000). Since China had a much
larger population than any individual European state throughout the second
millennium, and European data are available only for a subset of relatively
small nations or regions, the timing of the Great Divergence cannot be settled
by comparing the whole of China with Europe’s most developed nations.
Broadberry, Guan, and Li (2018, 2021) have argued that although China as a
whole was substantially poorer than the most developed parts of Europe by the
beginning of the fifteenth century, the Yangzi Delta, China’s most developed
region, only fell behind around 1700, somewhat earlier than suggested by
Pomeranz, but much later that usually assumed by economic historians of Europe.
However, the evidence for this is indirect, since Broadberry, Guan, and Li estimate a time series of GDP per head for China as a whole, and project it back from a benchmark comparison of GDP per head in the Yangzi Delta, obtained from Li and van Zanden’s (2012) comparison between the Yangzi Delta and the Netherlands in the 1820s. This effectively holds constant the ratio between GDP per head in China’s richest region and the empire as a whole. A new paper by Broadberry and Guan (2022) tests the validity of that assumption by examining the cross-sectional distribution of GDP per head in five benchmark years from the Song dynasty to the Qing. For the Ming and Qing dynasties, data are provided for seven macro regions of China, built up from detailed provincial and prefectural data. In addition, we track the position of the Yangzi Delta, the core of East Central China, which has generally been seen as the richest part of China during this period, and broadly comparable in size to individual European nations.
Our regional classification scheme must deal with both the expansion of Chinese territory and the changing administrative units as boundaries of provinces and prefectures have changed over time. There are six macro regions during the Song dynasty (Southeastern, Southwestern, East Central, Central, Northern, and Northwestern), increasing to seven during the Ming, with the seventh region (Other Territories) expanding to include Other States at the beginning of the Qing dynasty (see Figure 1).
Figure 1: Chinese macro regions during the Ming dynasty, c. 1400


One issue with this classification is that the East Central region contains around a quarter of the Chinese population and remains very large compared to any European nation. Furthermore, the Great Divergence literature has focused on the Yangzi Delta, which accounts for around one-third of the population of East Central China, encompassing the north and south banks of the Lower Yangzi River. This corresponds to a core region covering parts of three provinces: southern Jiangsu, northern Zhejiang, and southern Anhui. We thus include in our analysis the Yangzi Delta as a subregion of East Central China, which provides an appropriate unit for comparison with the leading nations of Europe.
Our basic approach is to obtain information on the regional distribution of output per head in the agricultural and non-agricultural sectors of the economy and aggregate them into a regional distribution of GDP per head. We therefore require data on the regional distribution of population as well as output of the main sectors of the economy. For agriculture, we need information on the cultivated land area and grain yields, while for non-agriculture we use data on the urbanisation rate by region.
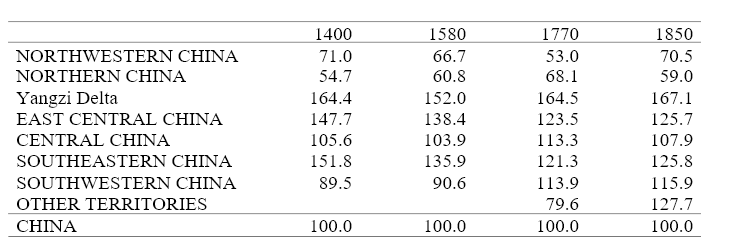
Table 1 combines the regional pattern of agricultural output per head with the data on regional urbanisation rates to estimate GDP per head relative to China as a whole for the period from 1400 to 1850, with the urbanisation rate capturing the variation in non-agricultural output per head. A number of results stand out. First, GDP per head was generally higher in the south than in the north. This follows from the high weight of agriculture together with higher grain yields in the south. Second, GDP per head was consistently higher in the East Central region than in China as a whole. Third, the core region of the Yangzi Delta had a GDP per head that was consistently higher than the rest of East Central China. Fourth, the scale of the Yangzi Delta GDP per head lead over China as a whole was 64 to 67 per cent in three of the four benchmarks, and 52 per cent higher during the late Ming.
Table 1: GDP per head relative to the China average, 1400–1850 (China=100)
It has not been possible to produce a complete regional breakdown of population, cultivated land area, grain yields, and urbanisation rates for the Song dynasty. This is unfortunate, because it is widely believed that Chinese economic leadership shifted from the largely wheat-growing north to the largely rice-growing south between the Song and Ming dynasties, with the diffusion of new strains of faster-ripening rice creating major changes in cropping practices and the distribution of population between the south and the north. The capital city during the Northern Song dynasty was Kaifeng, and we have been able to assemble data on the surrounding prefecture, Kaifeng Fu, to suggest that this was the richest region around 1080.
In Table 2, we estimate GDP per head in Kaifeng Fu relative to the China average. Cultivated land per head was about 65 per cent higher in Kaifeng Fu and grain yields are assumed to be equal to the Chinese average. Hence agricultural output per head in Kaifeng Fu was about 65 per cent above the national average. With the urbanisation rate in Kaifeng Fu more than three times the China average, this yields a GDP per head in Kaifeng Fu of a little more than twice the national average.
Table 2: GDP per head in Kaifeng Fu relative to the China average, circa 1080 (China=100)
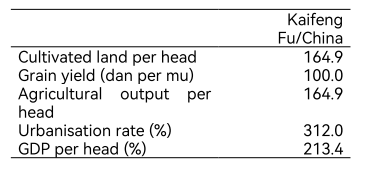
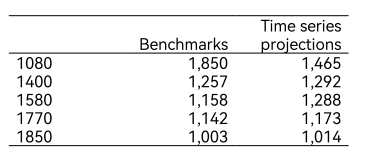
Table 3 shows GDP per head in the leading region of China in 1990 international dollars for each of the benchmark years, and compares them with the time series projections from Broadberry, Guan, and Li (2021) shown in Figure 2, which hold constant the ratio between GDP per capita in China’s leading region and the empire as a whole. During the Ming and Qing dynasties, only for 1580 is the difference more than 3 per cent. These benchmark estimates can thus be seen as broadly consistent with Broadberry, Guan, and Li’s (2021) characterisation of the Great Divergence beginning around 1700, as shown in Figure 2. Before then, GDP per head in the leading regions of Europe and China remained in the same ballpark, while the Great Divergence began from around 1700 as the leading parts of Europe made the transition to continuous modern economic growth at the same time that GDP per head in the leading parts of China entered a period of decline as population rapidly expanded.
Table 3: GDP per head in the leading Chinese region (1990 international dollars)
Our more speculative benchmark for the Northern Song dynasty circa 1080 suggests that GDP per head in the prefecture Kaifeng Fu containing the capital city, was richer than China as a whole by a rather larger proportion than the Yangzi Delta during the Ming and Qing dynasties. This indicates a level of GDP per head in the leading Chinese region of just over $1,850 in 1990 international prices, on a par with the highest levels reached in European nations during the late medieval and early modern periods. This therefore supports the view that Song dynasty China was the world economic leader at the time, consistent with the views of many earlier writers.
Figure 2: GDP per head in the leading regions of Europe and China, 1300–1850 (1990 international dollars)

Conclusions
Most work on Chinese historical national accounting focuses on obtaining estimates of GDP per head for China as a whole (Maddison 1998; Xu, van Leeuwen, and van Zanden 2018; Ma and de Jong 2019). However, this is not very satisfactory for establishing the timing of the Great Divergence of productivity and living standards between Europe and Asia because China was so much larger than the individual European nations for which GDP per head data are available. What is needed is systematic information on the regional variation of GDP per head within China.
For five benchmark years from the Song dynasty to the late Qing, we examine regional variation in Chinese GDP per head. For the Ming and Qing dynasties, we provide a breakdown of GDP per head across seven macro regions, establishing that East Central China was the richest macro region. In addition, we delve within the East Central macro region to present estimates for the Yangzi Delta, which has often been seen as the richest Chinese region. We have shown that the Yangzi Delta was the leading Chinese region, and that Yangzi GDP per head was 64 to 67 percent higher than in China as a whole for three of the four benchmark years and 52 per cent higher in the late Ming. For the Northern Song dynasty, we have shown that GDP per head in Kaifeng Fu was more than twice the level of China as a whole.
These data on regional variations in GDP per head can be combined with the aggregate data for Chinese GDP per head in 1990 international dollars and compared with GDP per head in European nations to assess the timing of the Great Divergence. This confirms the conclusion of Broadberry, Guan, and Li (2018, 2021) that the Great Divergence began around 1700, as the leading region of China fell decisively behind the leading region of Europe. It also supports the idea that China was the world economic leader in the Northern Song dynasty.
References
Broadberry, Stephen, and Hanhui Guan. 2022. “Regional Variation of GDP per Head within China, 1080–1850: Implications for the Great Divergence Debate,” CEPR Discussion Paper No. 17457. https://cepr.org/publications/dp17457.
Broadberry, Stephen, Hanhui Guan, and David Daokui Li. 2018. “China, Europe, and the Great Divergence: A Study in Historical National Accounting, 980–1850,” Journal of Economic History 78 (4): 955–1000. https://doi.org/10.1017/S0022050718000529.
Broadberry, Stephen, Hanhui Guan, and David Daokui Li. 2021. “China, Europe, and the Great Divergence: A Restatement,” Journal of Economic History 81 (3): 958–74. https://doi.org/10.1017/S0022050721000292.
Li, Bozhong, and Jan Luiten van Zanden. 2012. “Before the Great Divergence? Comparing the Yangzi Delta and the Netherlands at the Beginning of the Nineteenth Century,” Journal of Economic History 72 (4): 956–89. https://www.jstor.org/stable/41811360.
Ma, Ye, and Herman de Jong. 2019. “Unfolding the Turbulent Century: A Reconstruction of China’s Historical National Accounts, 1840–1912,” Review of Income and Wealth 65 (1): 75–98. https://doi.org/10.1111/roiw.12314.
Maddison, Angus. 1998. Chinese Economic Performance in the Long Run. Paris: Organisation for Economic Co-operation and Development. https://doi.org/10.1787/9789264163553-en.
Pomeranz, Kenneth. 2000. The Great Divergence: China, Europe, and the Making of the Modern World Economy. Princeton: Princeton University Press.
Xu, Yi, Bas van Leeuwen, and Jan Luiten van Zanden. 2018. “Urbanisation in China, ca. 1100–1900,” Frontiers of Economics in China 13: 322–68. https://doi.org/10.3868/s060-007-018-0018-9.

Latest
Most Popular
- VoxChina Covid-19 Forum (Second Edition): China’s Post-Lockdown Economic Recovery VoxChina, Apr 18, 2020
- China’s Great Housing Boom Kaiji Chen, Yi Wen, Oct 11, 2017
- China’s Joint Venture Policy and the International Transfer of Technology Kun Jiang, Wolfgang Keller, Larry D. Qiu, William Ridley, Feb 06, 2019
- The Dark Side of the Chinese Fiscal Stimulus: Evidence from Local Government Debt Yi Huang, Marco Pagano, Ugo Panizza, Jun 28, 2017
- Wealth Redistribution in the Chinese Stock Market: the Role of Bubbles and Crashes Li An, Jiangze Bian, Dong Lou, Donghui Shi, Jul 01, 2020
- Evaluating Risk across Chinese Housing Markets Yongheng Deng, Joseph Gyourko, Jing Wu, Aug 02, 2017
- What Is Special about China’s Housing Boom? Edward L. Glaeser, Wei Huang, Yueran Ma, Andrei Shleifer, Jun 20, 2017
- Privatization and Productivity in China Yuyu Chen, Mitsuru Igami, Masayuki Sawada, Mo Xiao, Jan 31, 2018
- Daily Price Limits and the Magnet Effect Ting Chen, Zhenyu Gao, Jibao He, Wenxi Jiang, Wei Xiong, Oct 25, 2017
- How did China Move Up the Global Value Chains? Hiau Looi Kee, Heiwai Tang, Aug 30, 2017


