A Bridge on Economic Issues between China and the World


 Facebook
  Twitter
  Instagram
 WeChat
  Email
Email Trade-Policy Dynamics: Evidence from 60 Years of US-China Trade
International trade depends on the effects of past trade policy and expectations of future trade policy. Disentangling these two forces is difficult, but the US-China trade relationship is ideally suited for study. A large, and largely unexpected, trade liberalization in 1980 kicked off a long, gradual expansion of Chinese exports to the United States. Until China’s accession to the World Trade Organization (WTO) in 2001, these low tariff rates were relatively easy to revoke, generating time-varying uncertainty over their future values. We show that the dynamics of Chinese exports to the United States are shaped by both forces, with policy uncertainty depressing trade throughout the period, particularly during the 1980s. Coinciding with China’s application to the General Agreement on Tariffs and Trade (GATT) in 1986, the likelihood of reversal fell dramatically, allowing trade in high tariff-risk goods to catch up. By the early 1990s the probability of higher tariff rates stood at about 10%. The persistence of this probability throughout the 1990s delayed the final adjustment to the initial 1980 reform until China’s Permanent Normal Trade Relations (PNTR) access.

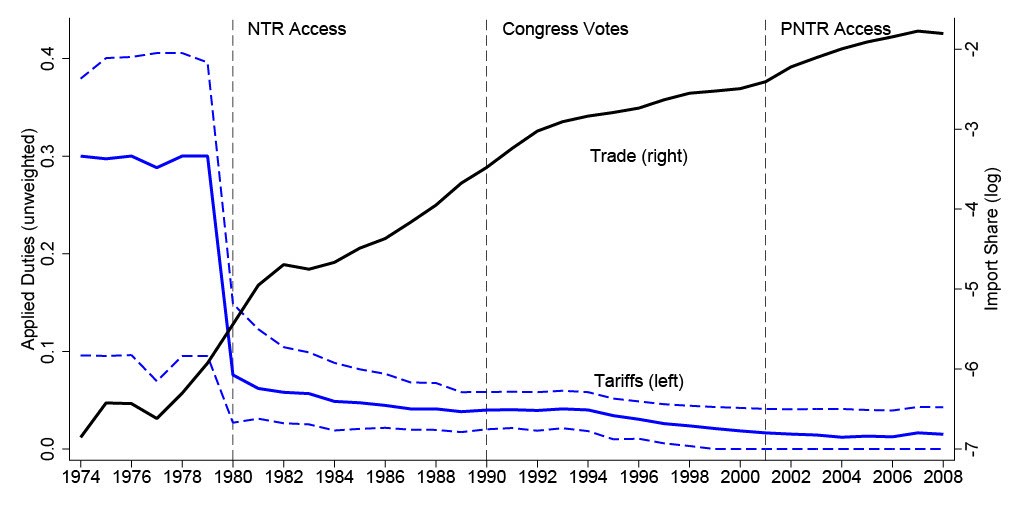
China’s integration into the world trading system, and the US economy in particular, is ideally suited to the study of trade policy dynamics. Between 1950 and 1970, the United States maintained a complete embargo on Chinese imports. China first gained access to the US market in 1971 at the relatively high Non-Normal Trade Relations (NNTR) tariff rates set in the 1930s. Figure 1 indicates that between 1974 and 1979, the median applied tariff (solid blue line) was around 30%, although there was substantial variation in tariffs across products. The second major reform, which occurred in 1980, gave China Normal Trade Relations (NTR) status on a conditional basis, allowing Chinese exporters to access the U.S. market at lower Most Favored Nation (MFN) tariff rates. The black solid line in Figure 1 illustrates that China’s import share to the United States grew sharply in advance of and immediately after the 1980 NTR liberalization. Beginning in 1990, revoking China’s MFN status was increasingly perceived as a potential sanctioning mechanism (Pierce and Schott, 2016), and the US Congress voted annually about whether to do so until China gained PNTR status in 2000 when it joined the WTO.
The Persistent Effect of the NNTR Gap on US Imports from China
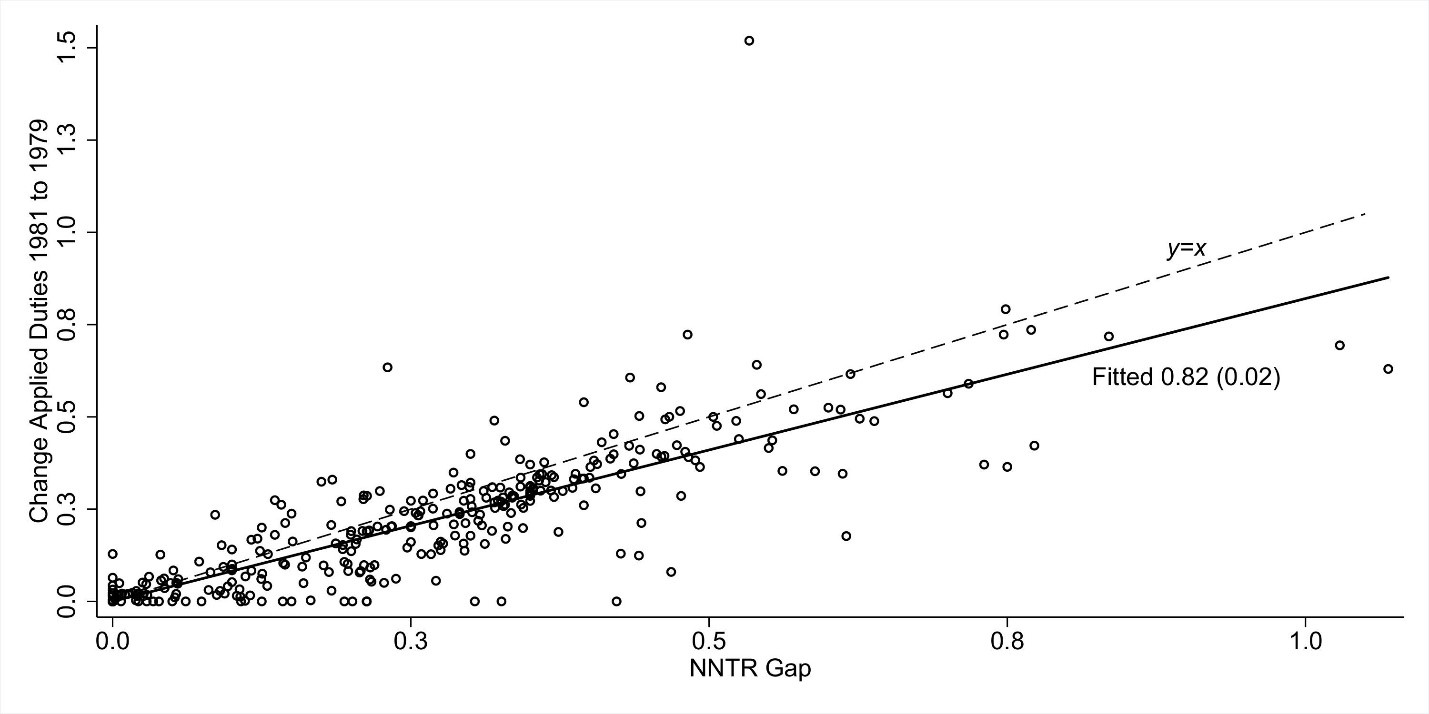
In an influential paper, Handley and Limão (2017) study the growth of US imports from China since the turn of the century and find trade growth to be related to the elimination of uncertainty regarding China’s access to MFN tariffs. Their evidence is that products with larger gaps between NNTR tariffs and MFN tariffs—products that would have faced relatively high tariffs if MFN access had been revoked—experienced relatively stronger import growth between the early 1990s and late 2000s. The NNTR gap, however, is also closely related to the initial reduction in tariffs that occurred after the 1980 NTR liberalization. Figure 2 illustrates the strong correlation between the NNTR gap and the change in applied duties between 1979 and 1981. Hence, the extent to which the NNTR gap should be viewed as a measure of the risk of losing MFN status in the 1990s depends on the persistence of the adjustment to the 1980 liberalization.
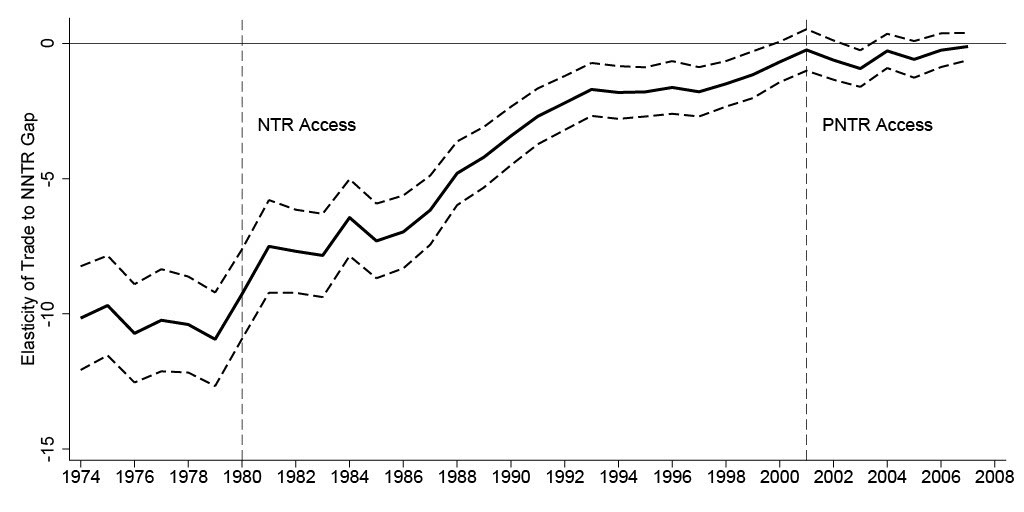
To study the gradual adjustment of the NTR liberalization, we revisit the effect of the NNTR gap on US imports from China, beginning our analysis in 1974 (the first year in which comprehensive data on US imports from China are available). We measure the elasticity of trade to the tariff gap year-by-year. Figure 3 shows how this elasticity has evolved over time. This effect was largest from 1974 to 1979, reflecting the fact that imports of products with low NNTR gaps had more trade in the decade after the embargo was lifted. The elasticity of trade to the NNTR gap fell sharply following the 1980 NTR liberalization, as products with higher NNTR gaps experienced larger tariff cuts and trade expanded in these products relatively more. This trade expansion, however, was not sustained beyond the first two years. In the mid-1980s, following China’s application to the GATT, trade in products with a high gap started growing relatively quickly and thus the elasticity of trade to the NNTR gap shrank steadily throughout the late 1980s and into the 1990s. These findings indicate that the adjustment to the NTR liberalization was very persistent and was likely slowed down by trade policy uncertainty (TPU) at the outset of the 1980 reform. Most of the difference in trade between high- and low-gap products disappeared before China’s WTO accession, indicating that this event—and the resulting reduction in TPU—played a smaller role in China’s integration into US markets compared with the earlier liberalization.
Model of Exporter Dynamics and TPU
To disentangle the effects of the NTR liberalization in 1980 from expectations about continued access to MFN tariff rates, we use a multi-industry version of the Alessandria, Choi, and Ruhl (2021) model of firm heterogeneity and export participation dynamics. To enter the US market, Chinese producers pay a large, sunk investment cost. After entering, new exporters’ sales grow gradually in a probabilistic fashion, allowing the model to generate a slow adjustment to tariff changes and capture the salient facts about exporters’ life cycles that have been documented in the literature (Ruhl and Willis, 2017; Alessandria, Arkolakis, and Ruhl, 2020; Steinberg, 2021). TPU is introduced to this setting by modeling two possible tariff regimes, NNTR and MFN, and probabilities of switching between regimes that vary over time. As in Handley and Limão (2017), TPU deters entry into the US market by reducing the present value of the future profits from exporting. Aggregate industry exports in the model are determined not only by contemporaneous tariffs, but also by the number of exporters and their respective export capacities, both of which depend on past and future policy.
The Expected Path of Trade Policy
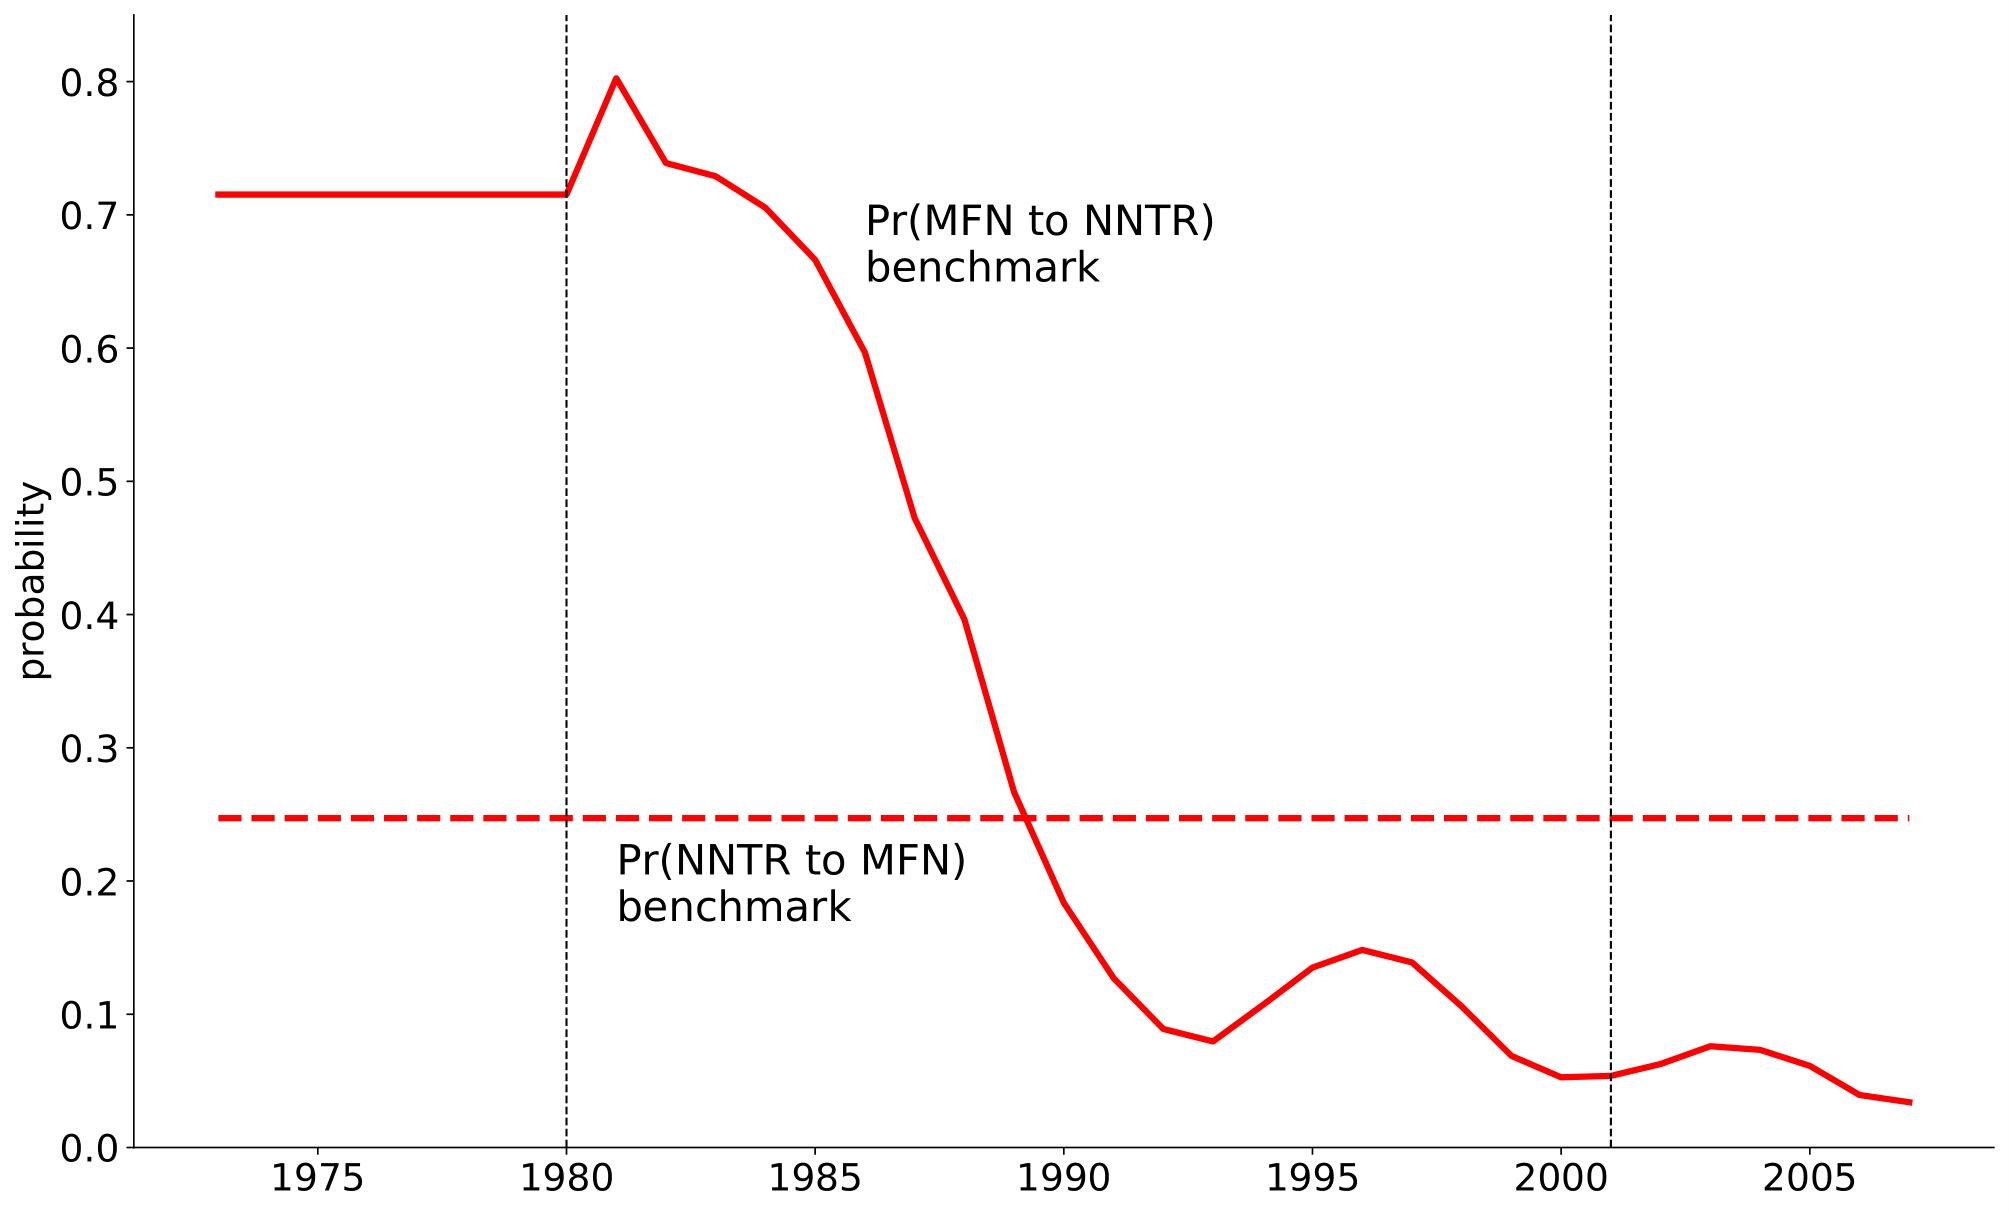
We parameterize the model to reproduce stylized facts about export participation and exporters’ life cycles and simulate the response to the observed path of realized tariffs in each of the industries in our empirical analysis. Specifically, we begin the model in 1971 in which all firms are non-exporters. They face NNTR tariffs during 1971–1979 and MFN tariffs from 1980 onward. We vary the probabilities of switching between tariff regimes to reproduce the evolution of the elasticity of trade to the NNTR gap depicted in Figure 3. Figure 4 shows the estimated probabilities generated from this procedure. The probability of switching from NNTR to MFN, which is estimated by matching the average NNTR gap effect during 1974–1979, was about 25%, which suggests that the 1980 NTR liberalization came largely as a surprise. The probability of switching back from MFN to NNTR is estimated by matching the annual NNTR gap effects from 1980 to 2007. The probability of losing access to MFN tariffs was high—more than 70%—for several years after the 1980 reform, reflecting the stagnation of the NNTR gap effect until the mid-1980s. This probability fell rapidly during the late 1980s, flattened at around 10% during the mid-1990s, and then continued to fall to about 5% by the time China joined the WTO in 2001. While we attribute these trade dynamics to a delayed and gradual rise in credibility of US trade policy towards China that lowered the expected tariff in industries with relatively high NNTR gaps, an alternative explanation would be for Chinese trade policy to provide targeted subsidies to export to the US market in the industries with a high tariff gap. While special treatment of exports was a common policy, we lack any direct evidence that such policies subsidized exports to the US more than exports to other countries.
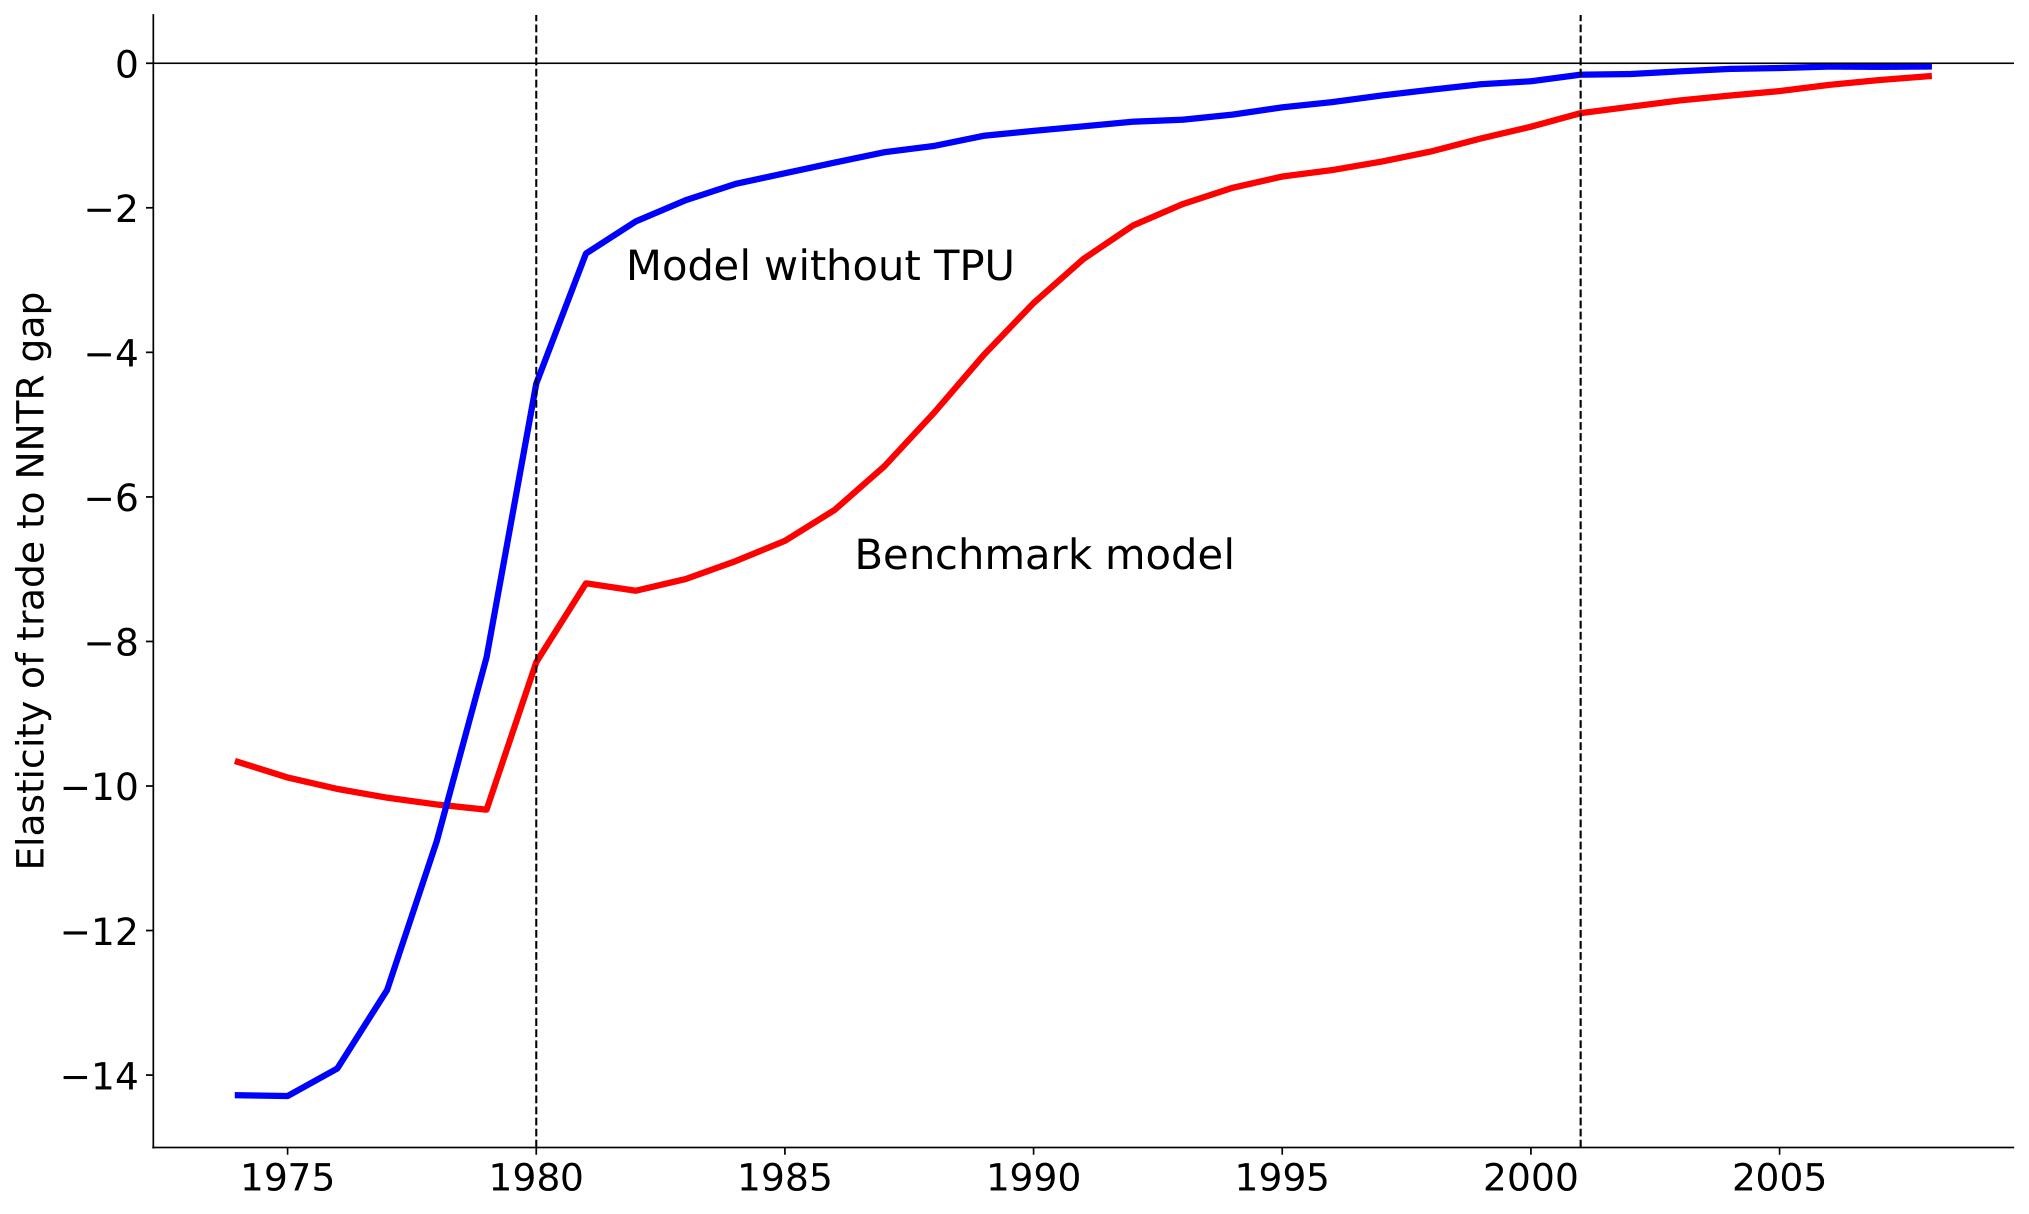
Our model allows us to ask the counterfactual question: What would the transition dynamics of US imports from China have been if the path of trade policy had been certain, rather than uncertain? Figure 5 shows that in this scenario, trade would have grown faster and the NNTR gap effect would have shrunk more quickly than in the benchmark model with uncertainty (and in the data). By 1985, in the model without uncertainty, the transition is about 90% complete, whereas in the benchmark model, only about one-third of the adjustment has been achieved. These results suggest that uncertainty played a major role in slowing down the adjustment to the 1980 NTR liberalization and that much of the trade growth that followed China’s WTO accession was a delayed response to the previous liberalizations and to the earlier reductions in TPU during the mid-1980s.
Conclusions / Relevance for Today
This research emphasizes the importance of disentangling the effects of past trade policy reform from expectations about future policy changes. In 2018, the United States unilaterally raised tariffs on Chinese goods from MFN rates to levels of 10–25%. These tariffs were imposed without any clear timeline and only vague conditions for their future removal, so a key question in interpreting the response of trade flows is how long US importers and Chinese exporters expected these tariffs to last. Our analysis of the effect of US-China trade policy prior to the recent trade war illustrates that there are strong interactions between the response to tariff changes and their expected persistence. The framework we propose (Alessandria, Choi, and Ruhl, 2021) provides a parsimonious methodology to recover the expectations about the reversal of the recent tariff increases from the behavior of firms following their implementation. Overall, our findings illustrate the importance of credibility of trade reforms and shine light on why trade has responded weakly to the recent tariff hikes. President Biden’s administration has largely kept these hikes in place, and as they come to be viewed as more persistent we expect that trade will begin to fall by more and more.
References
Alessandria, George, Horag Choi, and Kim J. Ruhl. 2021. “Trade Adjustment Dynamics and the Welfare Gains from Trade.” Journal of International Economics 131, 103458. https://doi.org/10.1016/j.jinteco.2021.103458.
Alessandria, George, Costas Arkolakis, and Kim J. Ruhl. 2020. “Firm Dynamics and Trade.” Annual Review of Economics 13 (1): 253–80. https://doi.org/10.1146/annurev-economics-090919-025159.
Alessandria, George, Shafaat Y. Khan, and Armen Khederlarian. 2019. “Taking Stock of Trade Policy Uncertainty: Evidence from China’s Pre-WTO Accession.” NBER Working Paper No. 29122. https://doi.org/10.3386/w25965.
Alessandria, George, Shafaat Y. Khan, Armen Khederlarian, Kim J. Ruhl, and Joseph B. Steinberg. 2021. “Trade Policy Dynamics: Evidence from 60 years of U.S.-China Trade.” NBER Working Paper No. 29122. https://doi.org/10.3386/w29122.
Anderson, James E. and Yoto V. Yotov. 2020. “Short Run Gravity.” Journal of International Economics 126, 103341. https://doi.org/10.1016/j.jinteco.2020.103341.
Baier, Scott L. and Jeffrey H. Bergstrand. 2007. “Do Free Trade Agreements Actually Increase Members’ International Trade?” Journal of International Economics 71 (1): 72–95. https://doi.org/10.1016/j.jinteco.2006.02.005.
Handley, Kyle, and Nuno Limão. 2017. “Policy Uncertainty, Trade, and Welfare: Theory and Evidence for China and the United States.” American Economic Review 107 (9): 2731–83. https://doi.org/10.1257/aer.20141419.
Khan, Shafaat Yar, and Armen Khederlarian. 2021. “How Does Trade Respond to Anticipated Tariff Changes? Evidence from NAFTA.” Journal of International Economics 133, 103538. https://doi.org/10.1016/j.jinteco.2021.103538.
Pierce, Justin R., and Peter K. Schott. 2016. “The Surprisingly Swift Decline of US Manufacturing Employment.” American Economic Review 106 (7): 1632–62. https://doi.org/10.1257/aer.20131578.
Ruhl, Kim J., and Jonathan L. Willis. 2017. “New Exporter Dynamics.” International Economic Review 58 (3): 703–26. https://doi.org/10.1111/iere.12232.
Steinberg, Joseph B. 2021. “Export Market Penetration Dynamics.” Working Paper. https://www.joesteinberg.com/pdf/Export_market_penetration_dynamics.

Latest
Most Popular
- VoxChina Covid-19 Forum (Second Edition): China’s Post-Lockdown Economic Recovery VoxChina, Apr 18, 2020
- China’s Great Housing Boom Kaiji Chen, Yi Wen, Oct 11, 2017
- China’s Joint Venture Policy and the International Transfer of Technology Kun Jiang, Wolfgang Keller, Larry D. Qiu, William Ridley, Feb 06, 2019
- The Dark Side of the Chinese Fiscal Stimulus: Evidence from Local Government Debt Yi Huang, Marco Pagano, Ugo Panizza, Jun 28, 2017
- Wealth Redistribution in the Chinese Stock Market: the Role of Bubbles and Crashes Li An, Jiangze Bian, Dong Lou, Donghui Shi, Jul 01, 2020
- Evaluating Risk across Chinese Housing Markets Yongheng Deng, Joseph Gyourko, Jing Wu, Aug 02, 2017
- What Is Special about China’s Housing Boom? Edward L. Glaeser, Wei Huang, Yueran Ma, Andrei Shleifer, Jun 20, 2017
- Privatization and Productivity in China Yuyu Chen, Mitsuru Igami, Masayuki Sawada, Mo Xiao, Jan 31, 2018
- How did China Move Up the Global Value Chains? Hiau Looi Kee, Heiwai Tang, Aug 30, 2017
- Daily Price Limits and the Magnet Effect Ting Chen, Zhenyu Gao, Jibao He, Wenxi Jiang, Wei Xiong, Oct 25, 2017


