A Bridge on Economic Issues between China and the World


 Facebook
  Twitter
  Instagram
 WeChat
  Email
Email Chinese Infrastructure Projects Help Spread Economic Activity in the Global South
Dec 29, 2021
Using our recently published geolocated dataset on Chinese government-financed transport infrastructure investments from 2000 to 2014, we show that these investments lead to a decentralization of economic activity within the subnational jurisdictions where they are located. Our analysis documents that this decentralization shifts activity toward suburban and peri-urban areas in low-income countries. We find no evidence suggesting that these projects systematically alter the distribution of activity across subnational jurisdictions.
China’s trillion-dollar Belt and Road Initiative (BRI)—a “belt” of road, rail, port, and pipeline projects that create an infrastructure corridor from China to Central Asia and Europe and a “Maritime Silk Road” that links China to South and Southeast Asia, the Middle East, and Africa through a series of deep-water ports along the littoral areas of the Indian Ocean—has provoked a great deal of speculation and controversy. Questions continue to swirl about the economic costs and benefits of BRI projects.
Beijing’s critics claim that it bankrolls “white elephant” projects that are politically motivated and economically unsustainable. Western donors and lenders point to individual roads that have fallen into a state of disrepair, airports in rural outposts that lie unused, and seaports with almost no container traffic. President Xi Jinping’s characterization of BRI as the “project of the century” has done little to dampen anxieties in Washington, London, and Brussels.
However, these concerns are difficult to reconcile with the positive experiences and observations of many developing country officials. In 2008, Senegal’s then President, Abdoulaye Wade, lavished praise on Beijing, noting that “with direct aid, credit lines and reasonable contracts, China has helped African nations build infrastructure projects in record time.” Some developing country leaders have gone further, singling out China as a major driver of economic development in their countries. Meles Zenawi, the former prime minister of Ethiopia, argued in 2012 that “one of the main reasons for [the] turnaround in the economic fate of Africa is the emergence of the emerging nations in general and China in particular.”
“Connective financing”—the provision of aid and credit for transportation infrastructure—is at the heart of the BRI. In his keynote address at the 2017 Belt and Road Forum for International Cooperation, Chinese President Xi Jinping indicated that the central objective of BRI is to build “land, maritime, air and cyberspace connectivity” and create “networks of highways, railways and sea ports.” In a previously published study, we provide evidence that many of these types of Chinese development projects accelerate economic growth in host countries.
Individual country case studies have shown that major transportation projects can decentralize economic activity [see Redding and Turner (2015) and Baum-Snow and Turner (2017) for recent reviews], while the evidence on the concentration of economic activity between regions suggests a large amount of heterogeneity [see, e.g., Jedwab and Storeygard (2020)]. However, it is unclear whether the findings from this country-specific literature can be generalized across a large sample of developing countries and a major new player in infrastructure financing.
In a recent working paper, we seek to address this question using evidence on China’s global infrastructure footprint and its consequences for economic concentration in developing countries. We start by pinpointing the locations of 269 Chinese government-financed transportation projects implemented in 86 countries and 1,211 subnational jurisdictions worldwide from 2000 to 2014 (see Figure 1). Our dataset mostly captures projects that predate the BRI. Still, the data are global in scope and include many of the same types of transportation infrastructure projects that have been financed under the auspices of the BRI since 2013.
Figure 1: Locations of Chinese-financed projects, transport and non-transport, 20002014
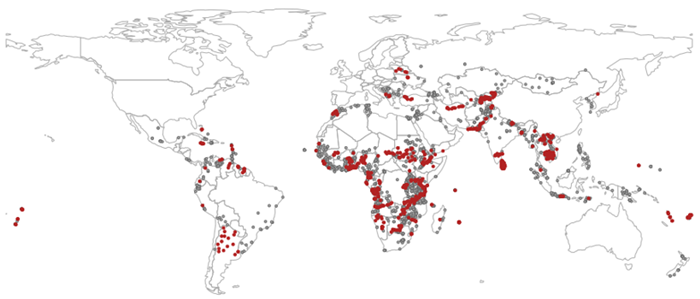
Notes: The figure illustrates all Chinese-financed transport (red) and non-transport projects (gray) committed and implemented from 2000 to 2014. It shows a total of 2,140 projects in 4,420 discrete locations, which have a precision accuracy of (at least) a first-order administrative division. Although there are “only” 269 transportation projects, 1,211 of the 4,420 locations shown in the figure have directly received (some part) of a larger transportation project.
We then use satellite imagery of nighttime light output to measure levels of economic concentration each year in more than 32,000 subnational localities around the world. More specifically, we calculate a Gini coefficient to measure economic concentration on a scale from 0 to 1. A value of 1 represents complete concentration—for example, a province in which a single 9.3 km by 9.3 km area contains all economic activity in that province—while a value of 0 represents complete dispersion, or a province in which every single 9.3 km by 9.3 km area has the same level of economic activity. We construct similar measures for the dispersion of activity between regions.
To illustrate how infrastructure projects can drive economic decentralization, consider a recent Chinese government-financed highway built in Kenya shown in Figure 2. The figure illustrates the change in nighttime lights from 2008 to 2013 along the Nairobi-Thika “superhighway” route in Kenya. The highway was reconstructed and widened from January 2009 until October 2012 and co-financed by a US$203.82 million loan from China Eximbank. After its completion, traffic flows increased substantially, and average commuting times fell from two to three hours to merely thirty to forty minutes [see, e.g., KARA and CSUD (2012), African Development Bank (2019)]. In the figure, it is easy to see that economic activity spread along the transport corridor and became substantially less concentrated in the core of Nairobi. Our concentration measures pick up this dispersion of activity as a decrease in the spatial Gini coefficient.
Figure 2: Nairobi-Thika Highway, change in nighttime lights, 2008–2013
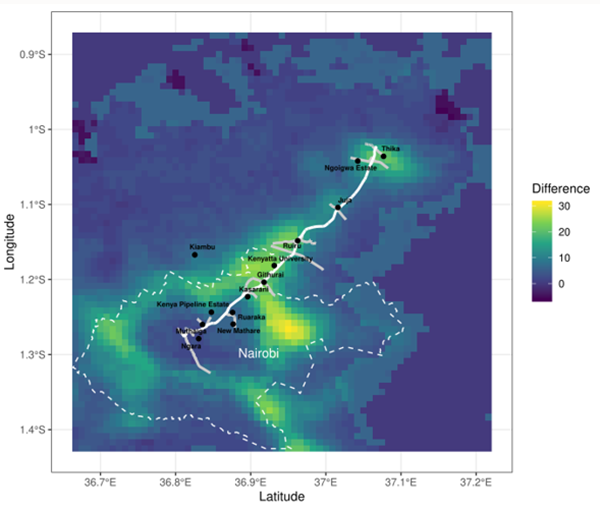
Notes: The figure illustrates the change in nighttime lights from 2008 to 2013 along the route of the Nairobi-Thika superhighway in Kenya. Major intersections and points of interest are highlighted along the highway. The change in nighttime lights is the difference between the F18 2013 image (in digital numbers, DN, ranging from 0 to 63) and the F16 2008 image (in the same units) of the Defense Meteorological Satellite Program. The differences have a range from –6 to 31 DN. The expansion of light around Nairobi is related to other infrastructure projects, many of which are also Chinese-financed but not highlighted here.
Reporting on the BRI also frequently mentions that China uses foreign aid and credit to export its “vast excess capacity in cement, steel, and other metal.” We build on this idea and use variation in the production of raw materials within China as an exogenous supply shock to infrastructure projects abroad. We also expect locations that receive projects more frequently to be more affected by these annual supply fluctuations than locations that receive fewer projects. Our results can be interpreted as a difference-in-differences or dose-response relationship. We compare the effects of Chinese government-financed transport projects on annual differences in economic concentration among regions that frequently and infrequently receive such projects. In our paper, we present many placebo tests to establish that this variation in Chinese production is not spuriously correlated with other variables.
Our findings demonstrate that Chinese government-financed transportation projects—such as roads, bridges, and railways—decentralize economic activity within the provinces and districts where they are implemented. On average, we find that these projects reduce economic concentration (as measured by the Gini coefficient of nighttime light output in all 9.3 km square grid cells within a particular subnational locality) by about 2.2 percentage points.
We also try to pinpoint where exactly this diffusion of economic activity is taking place. Here is what we find. First, Chinese connective infrastructure projects primarily reduce spatial concentration in poorer urban or peri-urban areas with above-median road density. Second, these types of projects reduce the share of economic activity in the highest quintile of the nighttime light distribution and increase the share of activity in the second, third and fourth quintiles. These two patterns suggest that economic output is relocating from dense areas like city centers to their immediate peripheries (i.e., peri-urban and suburban areas). These effects appear to be strongest in African countries. They accrue disproportionately to less-developed subnational jurisdictions within low-income and middle-income countries worldwide—where there are high baseline levels of demand for transportation infrastructure.
These findings provide some grounds for optimism. Since many of the low-income and middle-income countries included in our analysis suffer from an excessive concentration of economic activity in a small number of congested urban centers, our findings suggest that Chinese government financing for connective infrastructure promotes spatially inclusive economic development.
Our research findings should therefore be considered as part of a larger debate on the impacts of the BRI. Other research findings suggest that Chinese-financed projects can fuel local corruption, stoke ethnic tensions, weaken trade union participation, instigate public protests, and degrade the natural environment. There are also indications that Beijing’s aggressive lending program may saddle borrower governments—and their taxpayers—with unsustainable debt burdens. The effects of Chinese development projects vary across different types of outcomes, and even for a single outcome like economic concentration, they can produce heterogeneous effects under different conditions. As scholars, we do a disservice to those who make important decisions about cooperation and competition with China if we allow the policy debate to get hijacked by those who only offer conjecture and cherry-picked cases rather than credible evidence.
(Richard Bluhm, Assistant Professor, Institute of Macroeconomics, Leibniz University Hannover; Axel Dreher, Professor of International and Development Politics, Heidelberg University; Andreas Fuchs, Professor of Development Economics and Director of the Centre for Modern East Asian Studies, University of Göttingen; Bradley C. Parks, Executive Director, AidData, William & Mary; Austin M. Strange, Assistant Professor of International Relations, Department of Politics & Public Administration, University of Hong Kong; Michael J. Tierney, Hylton Professor of Government and International Relations and Director of Global Research Institute, William & Mary.)
References
African Development Bank (2019). Nairobi-Thika Highway Improvement Project: Project Completion Report. Abidjan: African Development Bank.
Baum-Snow, N. and Turner, M. A. (2017). Transport Infrastructure and the Decentralization of Cities in the People’s Republic of China. Asian Development Review, 34(2): 25–50.
Bluhm, R., Fuchs, A., Parks, B.C., Strange, A., Tierney, M.J. (2020). Connective Financing: Chinese Infrastructure Projects and the Diffusion of Economic Activity in Developing Countries, CEPR Discussion Paper 14818.
Jedwab, R. and Storeygard, A. (2020). The Average and Heterogeneous Effects of Transportation Investments: Evidence from Sub-Saharan Africa 1960–2010. NBER Working Paper 27670. Cambridge, MA: National Bureau of Economic Research.
KARA and CSUD (2012). The Social/Community Component of the Analysis of the Thika Highway Improvement Project. Kenya Alliance of Resident Associations (KARA) and the Center for Sustainable Urban Development (CSUD). Accessed at http://csud.ei.columbia.edu/files/2012/11/KARA-report_FINAL.pdf.
Redding, S. J. and Turner, M. A. (2015). Transportation Costs and the Spatial Organization of Economic Activity. In Duranton, G., Henderson, J. V., and Strange, W. C., editors, Handbook of Regional and Urban Economics, volume 5, chapter 20, pages 1339–1398. Elsevier.

Latest
Most Popular
- VoxChina Covid-19 Forum (Second Edition): China’s Post-Lockdown Economic Recovery VoxChina, Apr 18, 2020
- China’s Great Housing Boom Kaiji Chen, Yi Wen, Oct 11, 2017
- China’s Joint Venture Policy and the International Transfer of Technology Kun Jiang, Wolfgang Keller, Larry D. Qiu, William Ridley, Feb 06, 2019
- The Dark Side of the Chinese Fiscal Stimulus: Evidence from Local Government Debt Yi Huang, Marco Pagano, Ugo Panizza, Jun 28, 2017
- Wealth Redistribution in the Chinese Stock Market: the Role of Bubbles and Crashes Li An, Jiangze Bian, Dong Lou, Donghui Shi, Jul 01, 2020
- Evaluating Risk across Chinese Housing Markets Yongheng Deng, Joseph Gyourko, Jing Wu, Aug 02, 2017
- What Is Special about China’s Housing Boom? Edward L. Glaeser, Wei Huang, Yueran Ma, Andrei Shleifer, Jun 20, 2017
- Privatization and Productivity in China Yuyu Chen, Mitsuru Igami, Masayuki Sawada, Mo Xiao, Jan 31, 2018
- Daily Price Limits and the Magnet Effect Ting Chen, Zhenyu Gao, Jibao He, Wenxi Jiang, Wei Xiong, Oct 25, 2017
- How did China Move Up the Global Value Chains? Hiau Looi Kee, Heiwai Tang, Aug 30, 2017


