A Bridge on Economic Issues between China and the World


 Facebook
  Twitter
  Instagram
 WeChat
  Email
Email No Winners but Only Losers in the China-US Trade War

Trade tensions between China and the United States have played an important role in swinging global stock markets, but the effects are difficult to quantify. Using a comprehensive database constructed by Wisers, we develop a novel trade sentiment index (TSI) based on textual analysis that assesses the positive or negative tone of Chinese media coverage of the China-US trade situation and evaluates the TSI’s capacity to explain the behaviour of 60 global equity markets. We find the TSI to contribute to around 10% of the model’s capacity to explain stock price variability from January 2018 to June 2019 in countries that are more exposed to the China–US value chain. No equity market benefits from the China–US trade war, and Asian markets tend to be more negatively affected. Specifically, we find that sectors most affected by tariffs, such as those related to information technology, are particularly sensitive to the media tone regarding trade tension.
Trade tensions between China and the United States have created volatility in the global stock market in recent years (BIS, 2019), but the effects are difficult to quantify. For this reason, the literature has thus far mainly resorted to event studies that refer to specific episodes with a time horizon of just a few days. These papers analyse the behaviour of financial markets around specific announcements by both the US and Chinese governments of their intentions to raise tariffs on a comprehensive list of goods imported from the other (Huang et al, 2018; Sun et al, 2019; Ferrari et al, 2020).
Different to this strand of the literature, Amstad et al. (2021) go beyond specific events and try to quantify the contribution of trade sentiment in explaining equity price movements over a longer period (January 2018 to June 2019) (see Note 1). To do this, the study first constructs a daily “sentiment index” based on textual analysis of Chinese media and then examines its ability to explain the behaviour of global stock markets.
Graph 1: Dataset characteristics for the construction of the Trade Sentiment Index (TSI) (In per cent)
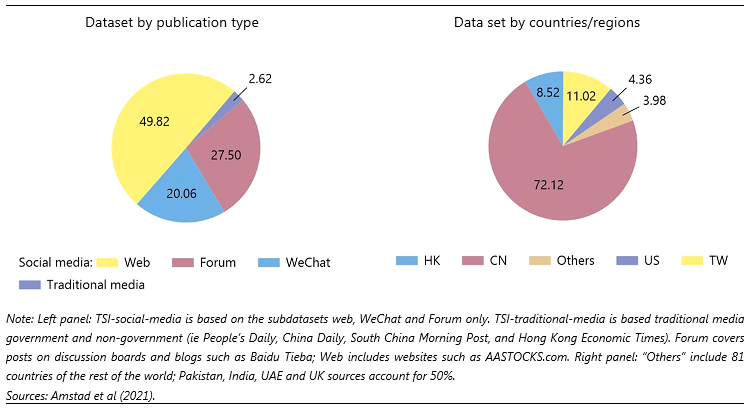
The “sentiment” index is constructed using Wisers data, one of the world’s largest Chinese media database (see Note 2). A broad spectrum of media outlets is covered. The left-hand panel of Graph 1 shows that “Social media” dominates the dataset, encompassing 1) “Web,” which covers media articles from websites such as AASTOCKS.com (50%), 2) “Forum,” which covers posts on discussion boards and other microblogs such as Baidu (27%), and 3)“WeChat,” which includes publicly available posts on social APPs (20%). “Traditional media” from 4,040 newspapers and magazines account for less than 3% of the database. Wiser data allow us to construct a TSI that covers different parts of the world. The right-hand panel of Graph 1 shows the data coverage by region: 92% of the articles are from publishers in Greater China.
The trade sentiment index (TSI) is calculated with machine learning techniques that help qualify the tone (positive or negative) associated with specific keywords (“trade war,” “trade frictions,”) in a sentence (see Note 3). For example, the TSI can differentiate sentences such as “the trade war intensifies” versus “the trade war is unlikely to intensify,” which a simple count of key words would treat equally (See Note 4).
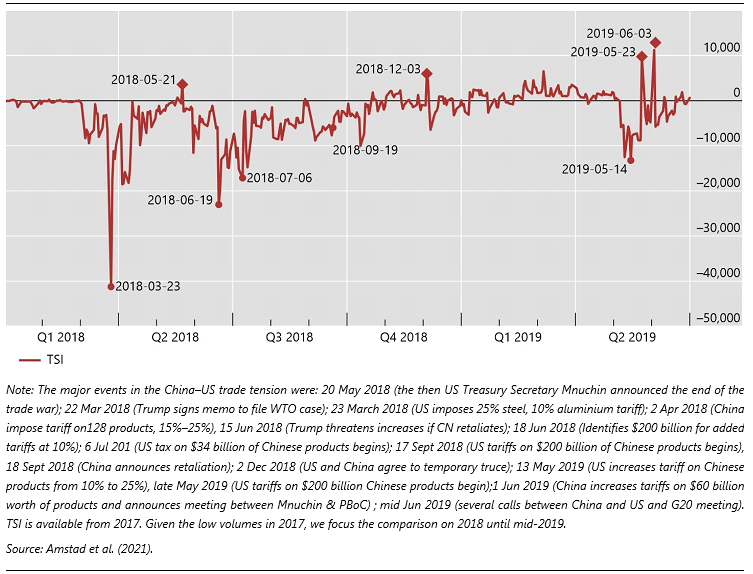
Graph 2 shows the evolution of the TSI index. Its dynamics matches key events in the China–US trade relation. For example, the first significant worsening in trade sentiment index coincided with the US president signing a memo to file a WTO case on 22 March 2018 and the United States imposing tariffs of 25% on steel and 10% on aluminium the next day.
Graph 2: Timeline of major events in China–US trade tension and the TSI index
Although the TSI is constructed mainly from Chinese media and is not country- specific, it has a large bearing on global equities. In particular, the TSI accounts for about 10% of the model’s capacity to explain the price movements in countries significantly exposed to the China–US value chain. Social media accounts for the majority of the impact (9%); traditional media contributes only modestly (1%).
Graph 3: Impact of TSI deterioration on domestic equity markets
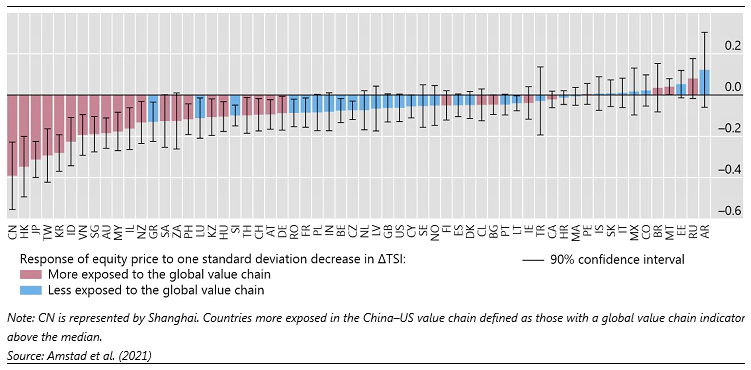
The response at the country level indicates that the trade war has no winner but only losers to different degrees. Indeed, no equity market benefits from worsening China–US trade sentiment, and Asian markets tend to be more negatively affected. Graph 3 reports the estimated change in stock prices in each country from a one standard deviation decrease in the TSI index with deteriorating trade sentiment. The impact of TSI is statistically significant in more than half of the stock markets we study.
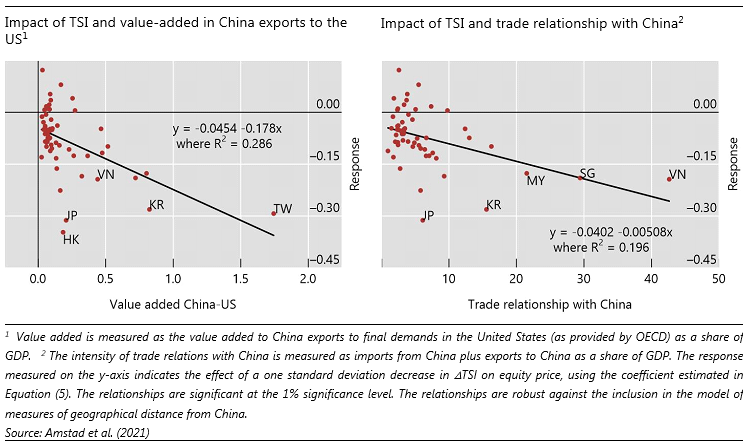
Looking into the drivers behind the country ranking in Graph 3, the individual country’s sensitivity is significantly related to its role in the China–US value chain. The more important a country’s role is in the value chain, the more sensitive its stock market returns react to the TSI (see Graph 4). Similar results are found in Sun et al. (2019).
Graph 4: Impact of a deterioration in TSI on equity markets and the China–US value chain
Tariffs are typically targeted towards specific sectors and trading partners. It is therefore interesting to evaluate the effects at the sectoral level.
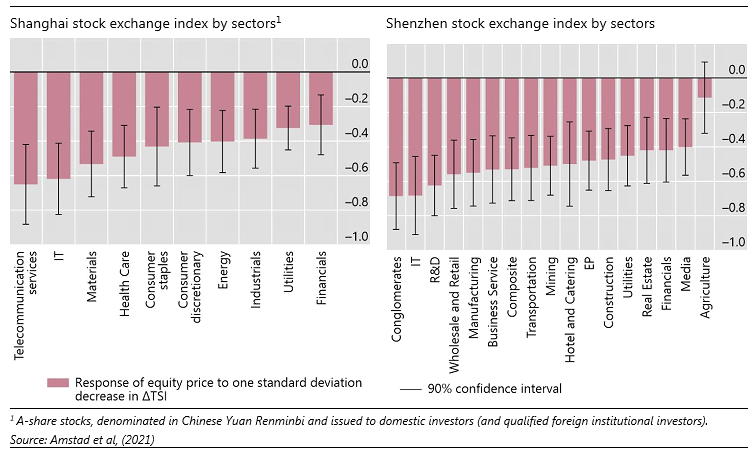
Graph 5 reports the effects of the TSI on sectoral equity prices in the Chinese mainland markets (both Shanghai and Shenzhen). Despite the differences in the types of listed firms in the Shanghai and Shenzhen markets, the IT-related sector is most responsive to a deterioration of the trade sentiment. This sector most affected by tariffs and this result is in line with industry reports cited earlier. In firms listed on the Shanghai Exchange, telecommunication services and IT stand out as being most vulnerable. By contrast, utilities and financials are the most resilient sectors. In firms listed on the Shenzhen Exchange, IT and R&D are the most sensitive sectors, with real estate, financials, media, and agriculture the least sensitive sectors. Consistently, firm-level analysis finds that Chinese firms listed on the Shanghai Exchange with larger revenue from the United States are more exposed to our TSI.
Graph 5: Impact of TSI deterioration on Chinese equity markets at the sectoral level
US equities reacted by less to our TSI than those in China. This result, at least in part, could reflect the fact that our TSI index is constructed using Chinese media. The US sectors that lose the most after a worsening of TSI are financials, IT, discretionary consumption, and industrials. IT emerges as one of the most sensitive affected US sectors, confirming the pattern that those sectors hit the most by tariffs are most sensitive to a deterioration of the trade sentiment.
Overall, we find no winners but only losers in the China–US trade war.
Note 1: The recent COVID-19 pandemic period is excluded from the analysis. In 2020, markets were largely driven by sentiment towards the pandemic. See, for example, Amstad et al. (2020).
Note 2: The raw dataset used in Amstad et al (2020a) consists of approximately 3.5 billion articles from a broad spectrum of 74,020 media sources over 2.5 years spanning between 1 January 2017 and 30 June 2019, equivalent to about 3 million articles per day.
Note 3: We include a broad set of keywords beyond “trade war” to account for the possibility that certain news outlets do not use this specific term.
Note 4: To cover different levels of severity in textual expressions, a number of relevant combinations of keywords have been selected to filter out trade-war–relevant articles from the raw data. For more information on the calculation of the TSI index, see Appendix A in Amstad et al. (2021).
The views in this paper are those of the authors only and do not necessarily reflect those of the Bank for International Settlements, or Wisers or any other institution the authors are affiliated with.
(Marlene Amstad, Harvard University; Leonardo Gambacorta, Bank for International Settlements and CEPR; Chao He, Wisers Information Limited; Dora Xia, Bank for International Settlements.)
References
Amstad, M, G Cornelli, L Gambacorta, and D Xia (2020). "Investors’ Risk Attitudes in the Pandemic and the Stock Market: New Evidence Based on Internet Searches.” BIS Bulletin 25.
Amstad, M, L Gambacorta, C He and D Xia (2021). “Trade Sentiment and the Stock Market: New Evidence Based on Big Data Textual Analysis of Chinese Media,” BIS Working Papers 917, Basel Switzerland.
BIS (2019). “Markets Swing on Trade and Monetary Policy,” BIS Quarterly Review, September.
Ferrari, M., F. Kurcz, M.S. Pagliari (2020). “Do Words Hurt More than Actions? The Impact of Trade Tensions on Financial Markets,” ECB working paper series No 2490, Frankfurt, November.
Huang, Y, C Chen, S Liu and H Tang (2018). “Trade Linkages and Firm Value: Evidence from the 2018 US-China ‘Trade War,’” Working Paper.
Sun, C, Z Tao, H Yuan, H Zhang (2019). "The Impact of the US–China Trade War on Japanese Multinational Corporations," RIETI discussion paper 19-E-050.

Latest
Most Popular
- VoxChina Covid-19 Forum (Second Edition): China’s Post-Lockdown Economic Recovery VoxChina, Apr 18, 2020
- China’s Great Housing Boom Kaiji Chen, Yi Wen, Oct 11, 2017
- China’s Joint Venture Policy and the International Transfer of Technology Kun Jiang, Wolfgang Keller, Larry D. Qiu, William Ridley, Feb 06, 2019
- The Dark Side of the Chinese Fiscal Stimulus: Evidence from Local Government Debt Yi Huang, Marco Pagano, Ugo Panizza, Jun 28, 2017
- Wealth Redistribution in the Chinese Stock Market: the Role of Bubbles and Crashes Li An, Jiangze Bian, Dong Lou, Donghui Shi, Jul 01, 2020
- Evaluating Risk across Chinese Housing Markets Yongheng Deng, Joseph Gyourko, Jing Wu, Aug 02, 2017
- What Is Special about China’s Housing Boom? Edward L. Glaeser, Wei Huang, Yueran Ma, Andrei Shleifer, Jun 20, 2017
- Privatization and Productivity in China Yuyu Chen, Mitsuru Igami, Masayuki Sawada, Mo Xiao, Jan 31, 2018
- Daily Price Limits and the Magnet Effect Ting Chen, Zhenyu Gao, Jibao He, Wenxi Jiang, Wei Xiong, Oct 25, 2017
- How did China Move Up the Global Value Chains? Hiau Looi Kee, Heiwai Tang, Aug 30, 2017


