A Bridge on Economic Issues between China and the World


 Facebook
  Twitter
  Instagram
 WeChat
  Email
Email Peer Effects, Political Competition, and Ecological Efficiency

This study examines the impacts of political competition on eco-efficiency. We first develop a theoretical model in which local government officials compete against each other to maximize their own political score. We find that after an initial stage of decline, eco-efficiency eventually increases once environmental performance becomes a meaningful component of local government officials’ annual assessment. These theoretical predictions are corroborated by the U-shaped pattern of eco-efficiency we compute for 191 Chinese cities from 2003–2015. We identify two peer effects that work in opposite directions for cities and regions: the incentivizing effect arising from higher-performing neighbors and the disincentivizing effect when a city outperforms its competitors. We also find evidence of political competition reducing eco-efficiency, as predicted in the theoretical model.
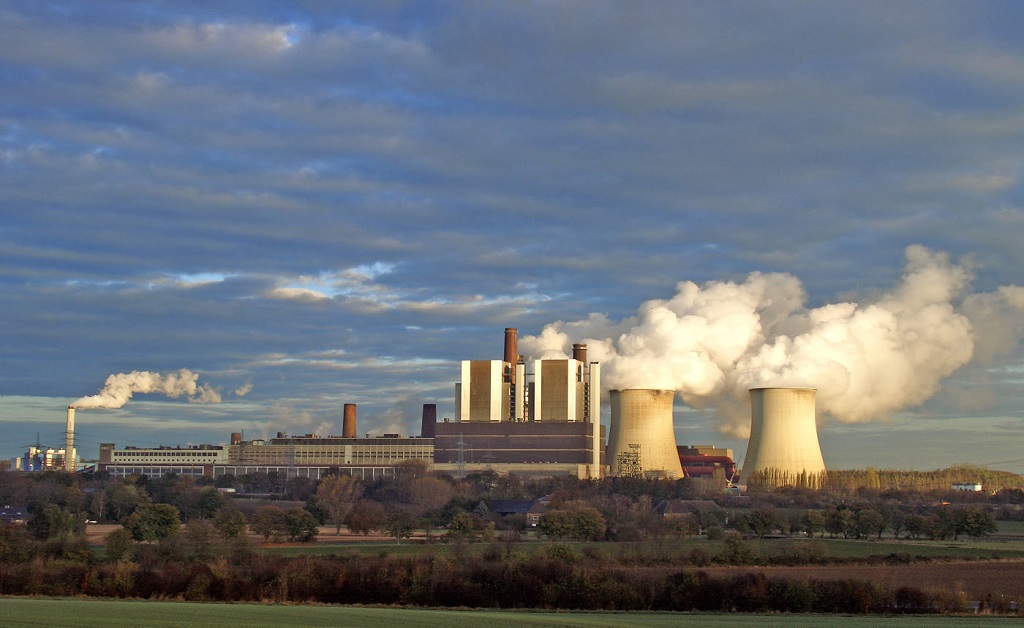
Eco-efficiency, a term generally considered to have been coined from ecological and economic efficiency, is a concept and philosophy geared toward sustainability and is measured in terms of the extent a process produces more goods and services while using fewer resources and creating less waste and pollution. The spectacular economic growth in China over the past few decades has been met by rising environmental challenges. On the one hand, China has surged ahead of the rest of the world in terms of material consumption, creating intense environmental pressures; on the other hand, it has remained among the most successful in improving its resource efficiency (UNDP 2013). To accurately measure the degree of transition in China toward eventual sustainable development, a comprehensive indicator such as eco-efficiency can be helpful.
In China, the tournament competition among city leaders is an important feature of its political system (Xu 2011). Local government officials compete to facilitate economic growth (Li and Zhou 2005), and to meet other targets set by higher authorities. As pollution has become one of China’s greatest threats––especially to health––the Chinese government has introduced a series of regulatory policies in recent decades. For example, in its National 10th Five-Year Plan (2001–2005), released in 2001, the central government for the first time added environmental protection and pollution reduction to its list of “national strategic goals,” and set a target to reduce pollutant discharges by 10% by the end of 2005. Under the new regulatory framework, each province was assigned a specific target, and the provincial government officials were to be evaluated on, among other things, how well these targets were met.
This paper investigates the evolution of the eco-efficiency level over the past few decades in China, and assesses its association with peer effects and subjurisdiction political competition. We first build a simple theoretical model of political competition among regional government officials, each of whom allocates resources between economic production and environmental protection. Our comparative statics analysis suggests that eco-efficiencyis negatively correlated with pollution intensity and positively correlated with financial endowment and political emphasis on the environment. These results are somewhat generic and expected considering that both “output” and environmental quality are desired as normal goods. However, for those results to hold, we would need to assume that environmental performance is a meaningful component of annual political assessment; otherwise, political competition would simply lead to a continual decline in eco-efficiency in a race-to-the-bottom fashion. This helps to explain the U-shape in the historical trend of eco-efficiency in countries that experience drastic (and favorable) changes in environmental policy and attitude.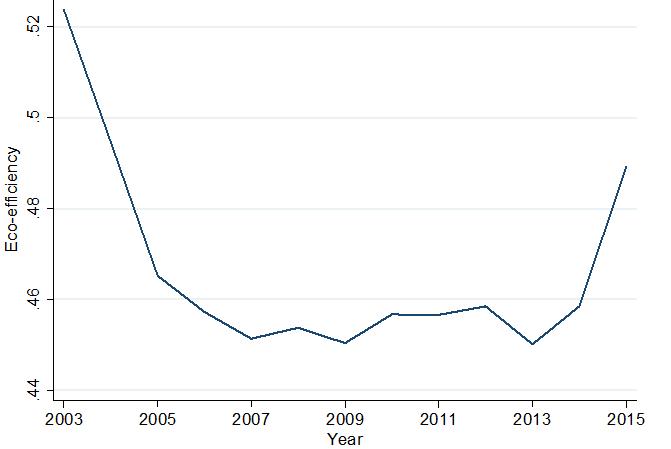
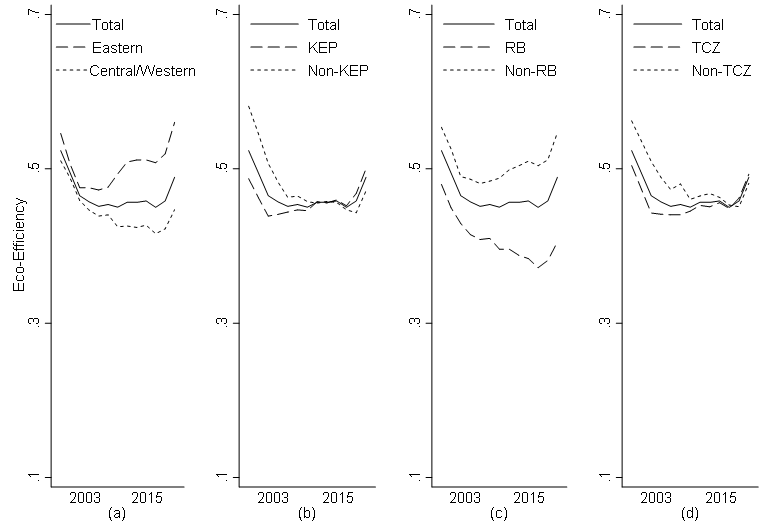
For our empirical work, we construct a total factor framework to compute the eco-efficiency levels of 191 Chinese cities between 2003–2015. For this purpose, we develop an extended data envelopment analysis (DEA) model that allows multiple inputs and outputs. We use labor force, capital stock, land usage, and energy consumption as input variables, while we treat the real GDP and the composite environmental pollution index as desirable and undesirable outputs, respectively. To maximize eco-efficiency, we assume that production units can control, and thus change, inputs and outputs simultaneously. As a result, the efficiency score calculated by the DEA model represents the eco-efficiency. As shown in Fig. 1, the evolution in eco-efficiency in China exhibited a U-shaped pattern during that period, with the rapid upward trend starting around 2013. We also examine heterogeneous patterns across different types of cities in Fig. 2. Fig. 2a suggests that the gap between cities in the east and central or western cities seems to have widened over time. Similarly, in Fig. 2c one can see that resource-based (RB) cities have always had significantly lower eco-efficiency levels than non-RB cities. Another concerning observation is that both RB cities and cities in the central and western regions witnessed a continual decline in eco-efficiency until around 2013, when the trend was reversed. This similarity might be explained by the fact that most RB cities are located in central or western regions with a historically unfavorable industrial structure, a weaker economic foundation, less advanced technology, and more-severe environmental issues. According to Fig. 2b, although key environmental protection (KEP) cities (see Note 1) started with inferior eco-efficiency compared to their non-KEP counterparts, the gap gradually narrowed until around 2012, when their non-KEP counterparts overtook them. Considering that the KEP cities are a mixture of cities with historically poor environmental records and cities of political importance, this overall pattern of catching up and then overtaking makes sense. As can be seen in Fig. 2d, the dynamic evolution of eco-efficiency in a two control zone (TCZ) aiming for acid rain mitigation versus a non-TCZ is very similar to the aforementioned KEP versus non-KEP comparison. It seems that the eventual reversal of the previously declining trend in eco-efficiency is attributable to the central leadership’s uneven attention in policy initiatives, as well as phased implementation.
Fig. 2. Eco-Efficiency Trends: Heterogeneities across Groups
To identify the peer effects on the convergence of eco-efficiency, we apply a two-regime spatial Durbin model with time and spatial fixed effects estimated through maximum likelihood, where the first regime (d) takes a value of 1 if a specific city’s eco-efficiency level is higher than the weighted average of its neighbors, and 0 otherwise. The second regime (or the complement of the first regime) is represented by the element (1-d). We find a significantly positive net peer effect. Specifically, without considering political competition, a city would see its eco-efficiency decrease by 0.240% triggered by a 1% increase in its lower-performing neighbors, but an increase by 0.775% with a 1% increase in its higher-performing neighbors. In addition, the positive net peer effect holds significantly in heterogeneous groups. We also investigate the effects of strategic political competition on eco-efficiency. In particular, we focus on how a city’s eco-efficiency is affected by its neighboring cities’ eco-efficiency in two different scenarios: with and without considering political competition. Our results show that in the presence of political competition, the peer effects (both disincentivizing and incentivizing) were amplified during 2003–2010, and attenuated during 2011–2015 as well as across the period as a whole.
This study provides both new theoretical extension and empirical evidence to the existing research on incentivizing bureaucrats with concrete evaluation criteria. One of the main foci of public economics has been strategic horizontal interaction among local governments. Our theoretical model projects that without integrating environmental performance into governors’ evaluations, political competition inevitably leads to continual deterioration in environmental quality. The results of our empirical analysis echo these theoretical predictions by exhibiting the effectiveness of including environmental factors in the assessment system, altering the pattern of eco-efficiency over time.
Overall, our study suggests that increased political competition leads to a decline in eco-efficiency. Despite considerable variations in eco-efficiency levels across cities and regions, we have identified a pattern of convergence arising from two peer effects. However, political competition also tends to slow the convergence process. These findings suggest that a well-designed evaluation system can be effective in motivating bureaucrats to shift their efforts toward a more environmentally friendly growth path.
Note 1: The State Council of China defines the resource-based (RB) cities in Planning for Sustainable Development of Resource-Based Cities in China (2013–2020), a document issued in 2013. They are usually cities of considerable political and/or economic importance, such as municipalities, provincial capitals, open coastal cities, and major tourist cities, although the list also includes cities with historical environmental issues and a more pressing need for environmental protection. KEP cities are subject to more-stringent environmental policies and standards compared to non-KEP ones.
(Xudong Chen, Ph.D., Professor of Economics and Finance School of Business, Baldwin Wallace University; Bihong Huang, Research Fellow, Asian Development Bank Institute; Yantuan Yu, Ph.D., Assistant Research Fellow, College of Economics, Jinan University.)
Cai, H., Chen, Y., Gong, Q., 2016. Polluting thy neighbor: Unintended consequences of China’s pollution reduction mandates. J. Environ. Econ. Manage. 76, 86–104.
Grossman, G. M., Krueger, A. B., 1995. Economic growth and the environment. Q. J. Econ. 110(2), 353–377.
Kaika, D., Zervas, E., 2013. The Environmental Kuznets Curve (EKC) theory—Part A: Concept, causes and the CO2 emissions case. Energy Policy 62, 1392–1402.
Li, H., Zhou, L. A., 2005. Political turnover and economic performance: the incentive role of personnel control in China. J. Public Econ. 89(9–10), 1743–1762.
OECD Secretariat. (2002). Indicators to measure decoupling of environmental pressure from economic growth. Sustainable Development, available at http://www.docstoc.com/docs/84838188/oecd_decoupling
Schmidheiny, S., WBCSD, 1992. Changing course: A global business perspective on development and the environment. Cambridge: MIT press.
UNDP, 2013. Resource Efficiency: Economics and outlook for China, available at http://wedocs.unep.org/handle/20.500.11822/8119
United Nations, 2009. Eco-efficiency indicators: measuring resource-use efficiency and the impact of economic activities on the environment. Greening of Economic Growth Series, ST/ESCAP/2561
Xu, C., 2011. The fundamental institutions of China’s reforms and development. J. Econ. Lit. 49, 1076–1151.

Latest
Most Popular
- VoxChina Covid-19 Forum (Second Edition): China’s Post-Lockdown Economic Recovery VoxChina, Apr 18, 2020
- China’s Great Housing Boom Kaiji Chen, Yi Wen, Oct 11, 2017
- China’s Joint Venture Policy and the International Transfer of Technology Kun Jiang, Wolfgang Keller, Larry D. Qiu, William Ridley, Feb 06, 2019
- The Dark Side of the Chinese Fiscal Stimulus: Evidence from Local Government Debt Yi Huang, Marco Pagano, Ugo Panizza, Jun 28, 2017
- Wealth Redistribution in the Chinese Stock Market: the Role of Bubbles and Crashes Li An, Jiangze Bian, Dong Lou, Donghui Shi, Jul 01, 2020
- Evaluating Risk across Chinese Housing Markets Yongheng Deng, Joseph Gyourko, Jing Wu, Aug 02, 2017
- What Is Special about China’s Housing Boom? Edward L. Glaeser, Wei Huang, Yueran Ma, Andrei Shleifer, Jun 20, 2017
- Privatization and Productivity in China Yuyu Chen, Mitsuru Igami, Masayuki Sawada, Mo Xiao, Jan 31, 2018
- Daily Price Limits and the Magnet Effect Ting Chen, Zhenyu Gao, Jibao He, Wenxi Jiang, Wei Xiong, Oct 25, 2017
- How did China Move Up the Global Value Chains? Hiau Looi Kee, Heiwai Tang, Aug 30, 2017


