A Bridge on Economic Issues between China and the World


 Facebook
  Twitter
  Instagram
 WeChat
  Email
Email Estimating China’s Growth Potential from Its Global Value Chain Position

We find that China’s potential growth in GDP per capita is substantially underestimated if the level of GDP per capita is employed as the convergence indicator as done in previous studies (e.g., Barro, 2015 and 2016). Using data on China’s position in the global value chain (GVC) prior to 2010, we predict that the country’s GDP per capita could have grown at 7%–8% annually between 2010 and 2015, which is closer to the actually growth rates of 7.8%, than predicted by the previous estimation of around 4%, which was based on GDP per capita.

China’s GDP growth rate decelerated to only 6% in the third quarter of 2019, raising a new round of concerns about China’s growth potential. This is similar to the scenario in 2012 when China’s GDP growth rate fell below 8%, which was the first time that happened since the 1990s. Barro (2016) predicts that China’s growth rate will soon fall from 8% to 3%–4%. In contrast, Justine Lin, a professor of Economics at Beijing University and former chief economist of the World Bank, believes that China’s GDP has the potential to grow at a rate of 8% until at least 2028. As the world’s second largest economy, China contributes to about 30% of global growth. An accurate estimation of China’s GDP growth potential is not only crucial for the country, but also critically important for the global economy.
In a recent paper, we argue that standard empirical growth analysis underestimates China’s GDP growth potential. In previous studies, the growth rate of per capita real GDP for a cross-section of economies between years t and t + τ is regressed on a convergence potential indicator and a list of control variables at time t. The convergence potential indicator tends to measure the distance of a country’s technology from the world technology frontier and per capita real GDP (in logarithms) (or the difference from that of the U.S.) is commonly used as the proxy for this indicator in empirical studies (e.g., Sala-i-Martin, 1996 and Barro, 2015). We argue that per capita real GDP is a misleading indicator for China.The empirical growth analysis is based on the belief of economic convergence in the long run. Through international trade, investment and other cross-border activities, lagging economies can learn and absorb knowledge from advanced countries. This catch-up process happens at a faster pace than the innovation activities that advanced economies engage in. Therefore, emerging markets may naturally grow faster than advanced economies keeping everything else constant. By the same token, a country’s economic growth slows when it becomes relatively richer and closes up its technology gap to the world frontier. Previous empirical studies document encouraging evidence on this prediction, though enormous debates remain in the literature on the speed, the extent, and the driving mechanisms of the convergence.
While previous empirical studies usually employ per capita real GDP as a proxy for the convergence potential indicator, there are several drawbacks in this practice. The choice of per capita real GDP is consistent with the observation that countries with higher incomes generally employ more-advanced technologies. However, many other factors besides technology, such as number of hours worked, contribute to the cross-country differences in per capita income. Therefore, a variable that is more directly linked to a country’s technology status than per capita GDP may be more appropriate for the empirical growth analysis.
We employ the GVC position index as the growth convergence indicator, replacing per capita real GDP, in the standard growth convergence regression. The GVC position index is measured by the percentage of value added (VA) from high-skilled labor in total domestic value added, which is calculated from the newly developed World Input Output Database (WIOD). The GVC index reflects a country’s position in the global value chain of production and is more closely linked to a country’s technology status when comparing to per capita real GDP. The choice of the GVC position index is motivated by recent studies on endogeneous economic growth such as Caselli and Clomeman (2006) and Acemoglu et al. (2006). In addition, the new convergence indicator also avoids the lagged dependent variable problem discussed in Barro (2015 and 2016).
We obtain the data we use to calculate the GVC position index from the World Input Output Database (WIOD), which provides an annual time series (from 1995 to 2010) of world input-output tables with information about VA by different types of labor (high-, medium- and low-skilled) for 38 countries. The labor skill types are based on educational attainment levels as defined in the International Standard Classification of Education (ISCED). High-skilled labor is defined as having attained the first and second stages of tertiary education in ISCED categories (see Note 1). We follow Timmer et al. (2015) to construct the value-added decomposition for the sectors in each country. We then calculate the ratio of VA from domestic skilled labor to the total domestic VA in each sector of a country. The weighted average of sector-wise ratios in each country is finally calculated as the GVC position index for the country of concern, with the weights being proportional to the total value added of each sector in the country (see Note 2).
Figure 1 shows the GVC position index and GDP per capita in each country and year in our sample from 1997 to 2010. It is evident that VA from high-skilled labor accounts for a higher share of total domestic VA in countries with higher per capita GDP. This is consistent with the fact that high-income countries usually specialize more in innovation activities than low-income countries. However, the two variables are far from perfectly correlated: the correlation is 0.51, indicating that GDP per capita is a noisy proxy for the distance to the global technology frontier.
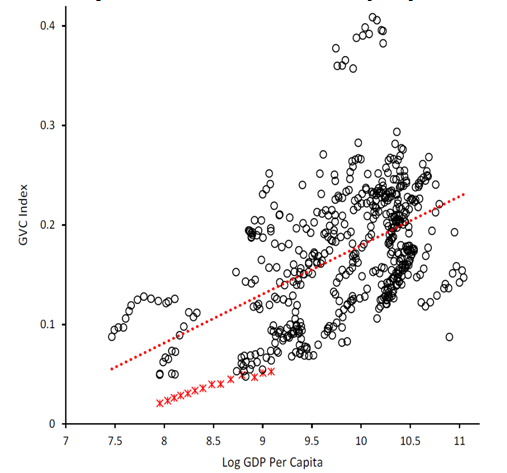
The asterisks in Figure 1 represent data regarding China. Both China’s per capita GDP and GVC positions have moved up significantly from 1997 to 2010. In particular, China’s per capita GDP has successfully moved from low-income countries in our sample to mid-income countries. However, the GVC position of China remains relatively low among the countries in our sample. The discrepancy between the relative positions of China’s per capita GDP and GVC position index induces the difference between our results and Barro’s (2016). The GVC position index suggests that China’s GDP growth potential may remain high, while the convergence indicator measured by per capita GDP predicts a much lower growth potential.
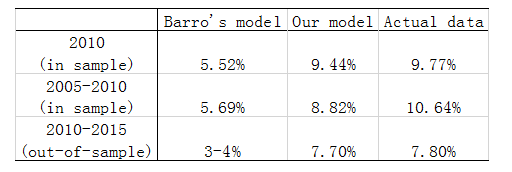
Our proposed GVC index (along with a set of control variables commonly used in the literature) performs better than per capita real GDP in forecasting China’s GDP growth (see Note 3). The root mean squared error (RMSE) is 11.7% smaller in the GVC modelwith both time and country fixed effects than that in the corresponding Barro model. The difference is over 40% if we compare our GVC model with Barro’s favorable model(the model with only the time fixed effects).Specifically, when using data from before 2010, we predict a much higher growth rate for China after the 2008 global financial crisis than Barro (2016). For instance, Barro’s favorite model predicts China’s 2010 growth rate to be 5.52%, while our estimate with the GVC index is 9.44%, which is much closer to the actual growth rate of 9.77% (Table 1). According to our out-of-sample prediction, China’s per capita GDP growth should have declined to 7.7% in the years between 2011and 2015, in sharp contrast to Barro’s pessimistic forecast of 3%–4%.
Many researchers believe that China’s high growth is unsustainable, which is understandable from a historical perspective. No large economy in history grew at China’s rate when its GDP per capita was at a similar level. When a country moves close to the global technology frontier (GTF), its growth inevitably slows as innovations happen at a much slower pace than technology adoption.
However, we argue that GDP per capital is a misleading indicator for China’s distance to the GTF. For instance, people have longer working hours and fewer vacation days in China than in most other countries. The data of GDP per capita that does not appropriately adjust for these factors may underestimate China’s distance to the GTF and its growth potential. Using an arguably better measure, the GVC position index, we estimate that China’s GDP growth potential remain above 7% between 2010 and 2015. It is reasonable to believe that the growth potential will remain between 6% and 7% after 2020. China needs to conduct structural reforms to fully utilize its potential rather than pessimistically believing that its economy can only grow at less than 6% each year. The pessimism and the policies based on such pessimism can be self-fulfilling, which would not only drag down China’s GDP growth but also threaten global growth prospects.
Note 2: As robustness checks, we also consider other indicators that are defined in a similar spirit, such as the unweighted average of sector-wise skilled-labor VA share in total VA, or the ratio of VA from domestic skilled labor to total domestic labor VA. The results are similar.
Note 3: Our sample includes 38 countries from which GVC data are available. Please see the paper for the list of these countries. In 29 out of 38 countries, the GVC model, with both country and time fixed effects, has smaller RMSE than that in Barro’s favorite model, which usesonly time fixed effects.
(Dazhong Cheng is a Professor of Economics at Fudan University; Jian Wang is an Associate Professor of Economics at The Chinese University of Hong Kong, Shenzhen; Zhiguo Xiao is an Associate Professor of Statistics at Fudan University.)

Latest
Most Popular
- VoxChina Covid-19 Forum (Second Edition): China’s Post-Lockdown Economic Recovery VoxChina, Apr 18, 2020
- China’s Great Housing Boom Kaiji Chen, Yi Wen, Oct 11, 2017
- China’s Joint Venture Policy and the International Transfer of Technology Kun Jiang, Wolfgang Keller, Larry D. Qiu, William Ridley, Feb 06, 2019
- The Dark Side of the Chinese Fiscal Stimulus: Evidence from Local Government Debt Yi Huang, Marco Pagano, Ugo Panizza, Jun 28, 2017
- Wealth Redistribution in the Chinese Stock Market: the Role of Bubbles and Crashes Li An, Jiangze Bian, Dong Lou, Donghui Shi, Jul 01, 2020
- Evaluating Risk across Chinese Housing Markets Yongheng Deng, Joseph Gyourko, Jing Wu, Aug 02, 2017
- What Is Special about China’s Housing Boom? Edward L. Glaeser, Wei Huang, Yueran Ma, Andrei Shleifer, Jun 20, 2017
- Privatization and Productivity in China Yuyu Chen, Mitsuru Igami, Masayuki Sawada, Mo Xiao, Jan 31, 2018
- Daily Price Limits and the Magnet Effect Ting Chen, Zhenyu Gao, Jibao He, Wenxi Jiang, Wei Xiong, Oct 25, 2017
- How did China Move Up the Global Value Chains? Hiau Looi Kee, Heiwai Tang, Aug 30, 2017


