A Bridge on Economic Issues between China and the World


 Facebook
  Twitter
  Instagram
 WeChat
  Email
Email China Caught in the “Middle-Income Trap”?

Since 2010–2011, China’s economy has slowed considerably, raising concerns that the country could fall into the so-called “middle-income trap” (MIT). Obviously, an MIT in China would have serious negative consequences not only for the Chinese population but also for the world economy as a whole. We examine whether China is or will be in an MIT by focusing on the empirical MIT definitions and the MIT triggering factors identified in the literature. We show that dependent on the choice of MIT definition, different MIT statements can be derived. Our triggering factor analysis reveals that while China performs quite well regarding its export structure, it must improve human capital accumulation and total factor productivity to avoid falling into an MIT.
The term MIT, first used by Gill and Kharas (2007), usually refers to the often-observed case of a developing country’s growth rate decreasing significantly when the country reaches the middle-income range (MIR). A common explanation for this development is that the initial growth drivers (productivity gains due to capital and labor reallocation to the more productive industry sector and low-wage advantages) become exhausted once a country has reached the MIR. According to a prominent World Bank (2013) study, only 13 of 101 middle-income countries succeeded in achieving high-income status between 1960 and 2011. The remaining countries—primarily located in Latin America and Asia—were “caught” in the MIR for more than half a century. Moreover, especially since China’s economic downturn, the question of whether the country is also at risk of an MIT has entered the political debate. For example, Li Keqiang mentioned it at the 12th National People's Congress in March 2016, and one year earlier, then Finance Minister Lou Jiwei warned that China had a 50% chance of falling into an MIT.
In our paper (Glawe and Wagner, 2017a), we investigate whether China is or will be in the MIT. We base our analysis on the two major concepts identified in the literature. On the one hand, there are triggering factors that either accelerate or impede growth. On the other hand, the literature also proposes various empirical definitions with which it can be determined whether a country is “trapped.” We discuss to which extent these two concepts are appropriate for identifying an MIT in China. In particular, we not only survey the recent literature, but also make our own MIT forecasts and analyze under which conditions China could be caught in an MIT. We also elaborate on the main weaknesses of the MIT concept. Most important, we find that the arbitrary nature of the MIR threshold choices has strong implication for the question of whether a country is identified as an MIT country.
Empirical definition approach
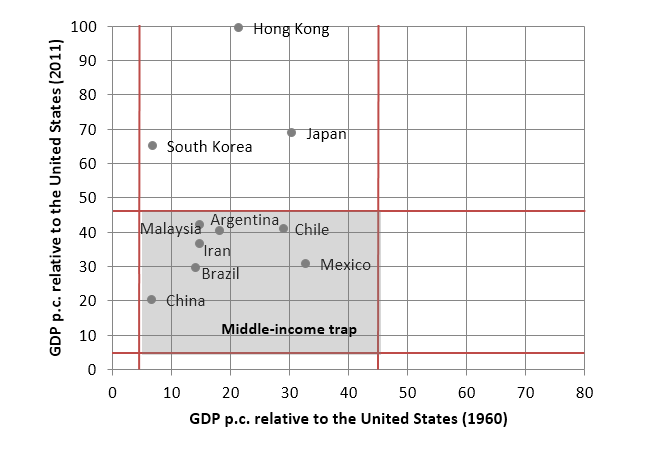
Empirical MIT definitions can be broken down into absolute and relative definitions. The former are based on absolute middle-income thresholds, whereas the latter refer to the GDP per capita relative to a developed country— the U.S. in most cases (see Figure 1 for graphical illustrations).
Data Source: GDP per capita series calculated using data from the PWT, Version 9.0.
Note: Updated version of Figure 3 in Glawe and Wagner (2016). Figure a: shows PPP adjusted GDP per capita in 2011 in U.S. dollars; the grey shaded area illustrates (an example of) the MIR, in particular, the Aiyar et al. (2013) middle-income thresholds. Figure b shows percentage of GDP per capita relative to the U.S.; the shaded area denotes the MIT countries (according the World Bank, 2013, definition).
With the empirical definitions, we aim to answer two main questions. First, is China already in an MIT according to certain definitions, or, alternatively, has China succeeded in catching up to the advanced countries? Second, will China become trapped in the future according to certain definitions, or, alternatively, will China be able to surpass the MIR in a timely manner? We apply the different MIT definitions to China, extend the data with various databases and database versions, and use projections to make MIT forecasts. In particular, we use the absolute MIT definitions of Eichengreen et al. (2012, 2014) and Felipe et al. (2012, 2017) as well as the relative definitions of the World Bank (2013), Woo et al. (2012), and Bulman et al. (2014). The majority of definitions used by these authors refers to an MIT period that is longer than 40 to 50 years; however, the middle-income thresholds differ significantly across studies: For example, the World Bank (2013) defines the MIR as ca. 4.5%-45% of US per capita income, Woo et al. (2012) as 20%-55%, and Bulman et al. (2014) as 10%-50%.
For the growth forecasts, we use the projections of the Conference Board (2010, pessimistic scenario), OECD (2012), World Bank (2013), Bailliu et al. (2014), Albert et al. (2015), Zhang et al. (2015), and the World Economic Outlook April 2016 forecast of the IMF. A detailed discussion of our various scenarios is provided in our paper.
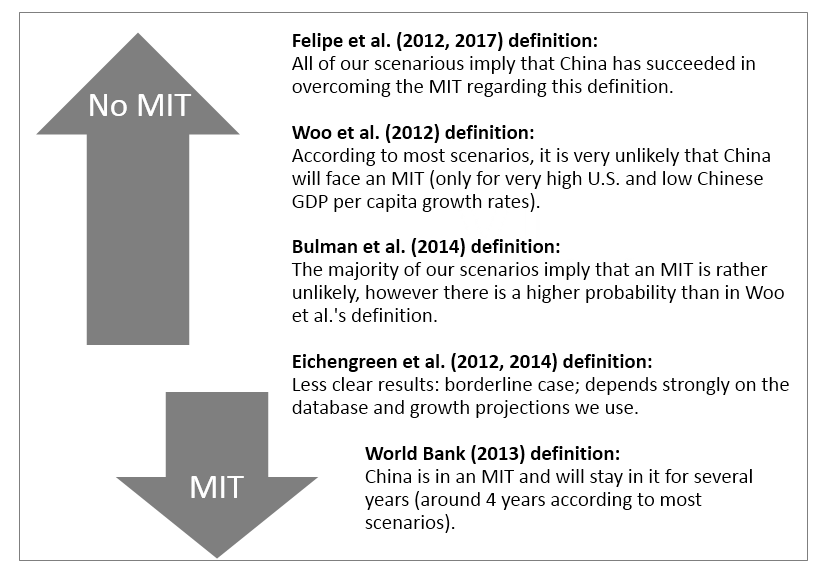
Our main findings can be summarized as follows. Depending on which definition, database, and growth projections we use, we can find empirical support for all possible cases: China is (or is not) in an MIT and it will (or will not) fall into in the MIT (see also Figure 2). Thus, it is relatively easy to generate a “desired outcome.”
However, there are some consistencies: The majority of our scenarios imply that China is not yet in an MIT. Moreover, in most of our scenarios, China is or soon will be in the MIR but not caught in an MIT (the World Bank, 2013, definition is the only exception). Indeed, China will only enter an MIT if the growth rate drops to the levels predicted by the most pessimistic scenarios in the literature, that is, 3–4%. Overall, our analysis yields slightly optimistic results regarding China with respect to the definition approach.
Finally, we elaborate on the main weaknesses of the empirical definitions. Besides the standard problems associated with cross-country growth regressions, there are several other rather conceptual problems. The main point of criticism is that the middle-income thresholds differ considerably across studies. This can have significant impacts on the MIT results (i.e., on the question of whether a country is identified as an MIT country). The GDP data discrepancy across databases and across different versions of databases is another important problem that is a further source of ambiguity in the results of the definition approach.
Triggering factor approach
Regarding the triggering factor approach, we perform a meta-analysis of the general literature on the MIT. In total, there are about 18 factors that are considered pertinent for identifying a prolonged growth slowdown at the MIR. In our paper, we classify these factors into several (sub)groups to allow for a clearer overview on a more aggregated level. In particular, we differentiate between monetary/macroeconomic factors, real economy/production factors, institutions, financial markets, and inequality (see Figure 3).
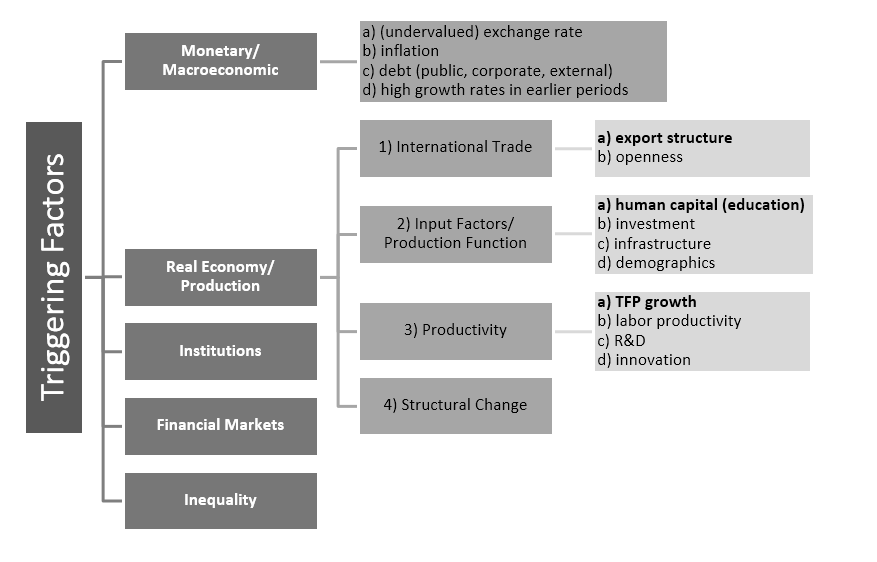
We find that triggering factors related to the real economy/production appear to be most important, in particular, human capital, the export structure, and total factor productivity (TFP). Finally, we study the development of these three indices in China and discuss whether they will trigger an MIT in China.
In general, China’s progress regarding these indicators is mixed. In the following, we briefly present the development of the most important indices in China (an extensive discussion can be found in our paper).
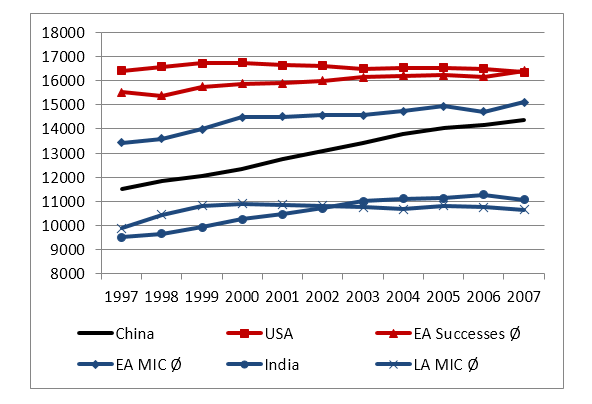
On the one hand, the export situation looks promising. Important indicators such as the share of hightech exports in GDP and the EXPY index (capturing the sophistication of a country’s export basket) indicate that China performs very well in cross-country comparison. Studies focusing on the EXPY index even state that China’s performance is better than what would be expected considering its GDP per capita. Figure 4 illustrates China’s steadily improving export sophistication and its strong catching up tendency.
Data Source: Jarreau and Poncet (2009); own calculations.
Note: “EA Successes Ø” stands for the average of the Asian success countries (South Korea, Japan, Singapore, and Hong Kong); “EA MIC Ø” and “LA MIC Ø” depict the average of some East Asian middle-income countries (Malaysia, the Philippines, and Thailand) and, respectively, of some Latin American middle-income countries (Brazil, Peru, Bolivia, and Mexico) that are considered as MIT countries by various empirical studies.
On the other hand, improvements with respect to the human capital and education seem necessary. We start with some quantitative indicators, specifically, the percentage of the population that has completed secondary and tertiary education (see Figure 5). Although there have been improvements regarding these indicators (especially since the (mid-1980s), the stagnation (or even negative) trends since the 2000s and the low levels and slow growth of tertiary education in cross-country comparison are worrisome (China still lags behind even various Latin American and East Asian MIT countries).
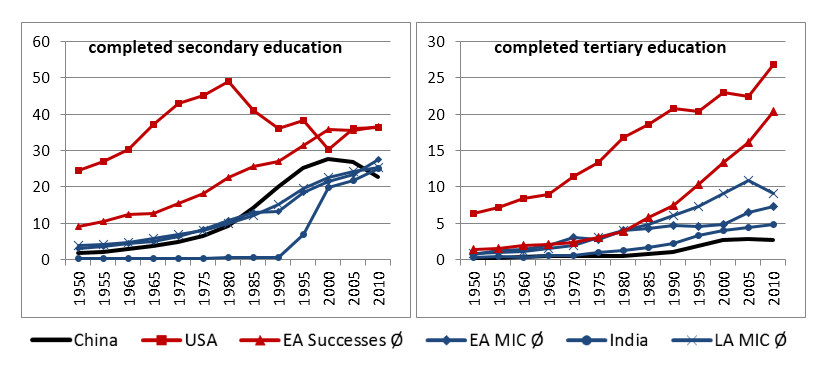
Data Source: Barro and Lee (2013); own calculations.
Note: Completed secondary or tertiary education is expressed in % of the total population aged 15 and older. Abbreviations are defined as described in the Notes of Figure 4.
Regarding the qualitative aspect, although the PISA data indicate that China performs very well, these results should be treated with caution as only Shanghai, China is covered in this study. Finally, insufficient access to education for rural and rural-urban migrant children and the corresponding widening rural-urban human capital gap (depicted by Figure 6) could have serious negative impacts on the quality of large parts of the future labor supply.
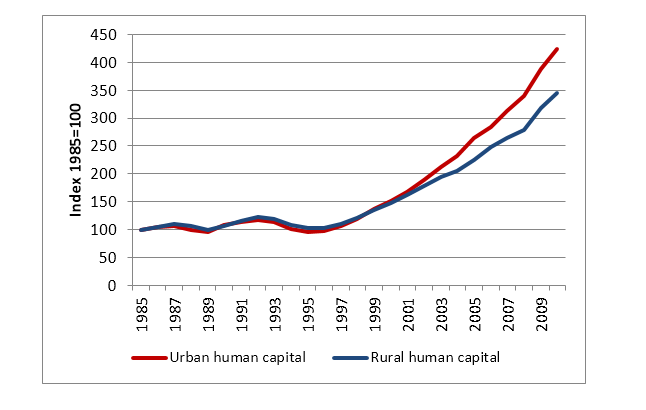
Data Source: OECD (2015).
It is much harder to evaluate China’s performance regarding productivity, mainly because TFP estimates differ strongly across studies. However, in general, there has been a gradual decrease in productivity in the last two decades. This can be partly attributed to the fact that in the course of structural change, China is currently confronted with the beginning of deindustrialization. In the coming years, the service sector will become by far the greatest sector of the Chinese economy; however, the service sector is generally characterized by slower productivity growth compared to the manufacturing sector that has (among others) driven China’s growth in recent years (see Glawe and Wagner, 2017b). Thus, future reforms should also focus on improving productivity in the service sector.
According to our analysis, China definitely has the potential to further catch up to high-income countries and to avoid an MIT. However, the future performance of the Chinese economy depends on further reforms initiated by China’s policy makers, especially regarding improvements in (service sector) TFP growth and human capital accumulation.
Aiyar, S., R. Duval, D. Puy, Y. Wu, and L. Zhang. 2013. Growth Slowdowns and the Middle-Income Trap. IMF Working Paper 13/71. Washington, DC: International Monetary Fund.
Albert, M., C. Jude, and C. Rebillard. 2015. The Long Landing Scenario: Rebalancing from Overinvestment and Excessive Credit Growth, and Implications for Potential Growth in China. Banque de France, Working Paper No. 572. Paris: Banque de France.
Bailliu, J., M. Kruger, A. Toktamyssov, and W. Welbourn. 2014. What’s Driving Economic Growth in China? Accounting for Overinvestment, Housing and Human Capital. Mimeo, Bank of Canada.
Bulman, D., M. Eden, and H. Nguyen. 2014. Transitioning from Low-Income Growth to High-Income Growth—Is There a Middle Income Trap? Policy Research Working Paper No. 7104. Washington, DC: World Bank.
Conference Board. 2010. Global Economic Outlook 2011. New York: Conference Board.
Eichengreen, B., D. Park, and K. Shin. 2012. When Fast-Growing Economies Slow Down: International Evidence and Implications for China. Asian Economic Papers 11(1): 42–87.
Eichengreen, B., D. Park, and K. Shin. 2014. Growth Slowdowns Redux. Japan and the World Economy 32: 65–84.
Felipe, J., A. Abdon, and U. Kumar. 2012. Tracking the Middle-Income Trap: What is it, Who is in it, and Why? Levy Economics Institute of Bard College, Working Paper No. 715. Annandale-on-Hudson, NY: Levy Economics Institute.
Felipe, J., U. Kumar, and R. Galope. 2017. Middle-Income Transitions: Trap or Myth? Journal of the Asia Pacific Economy 22(3): 429-53.
Gill, I., and H. Kharas, 2007: An East Asian Renaissance—Ideas for Economic Growth. World Bank: Washington, DC.
Glawe, L. and H. Wagner. 2016. The Middle-Income Trap: Definitions, Theories and Countries Concerned—A Literature Survey. Comparative Economic Studies 58(4): 507–538.
Glawe, L. and H. Wagner. 2017a. The People’s Republic of China in the Middle-Income Trap? ADBI Working Paper No. 749. Tokyo: Asian Development Bank Institute (ADBI).
Glawe, L. and H. Wagner. 2017b. A Stylized Model of China’s Growth Since 1978. SSRN Working Paper No. 2917433 and CEAMeS Discussion Paper No. 5. Hagen: Center for East Asia Macroeconomic Studies.
OECD. 2012. Looking to 2060: Long-Term Global Growth Prospects. OECD Economic Policy Papers No. 03. Paris: OECD Publishing.
OECD. 2015. OECD Economic Surveys: China. Paris: OECD Publishing.
Woo, W. T., M. Lu, J. D. Sachs, and Z. Chen. 2012. A New Economic Growth Engine for China: Escaping the Middle-Income Trap by Not Doing More of the Same. Singapore: World Scientific Publishing Company. London: Imperial College Press.
World Bank. 2013. China 2030: Building a Modern, Harmonious, and Creative High-Income Society. Washington, DC: World Bank.
The term MIT, first used by Gill and Kharas (2007), usually refers to the often-observed case of a developing country’s growth rate decreasing significantly when the country reaches the middle-income range (MIR). A common explanation for this development is that the initial growth drivers (productivity gains due to capital and labor reallocation to the more productive industry sector and low-wage advantages) become exhausted once a country has reached the MIR. According to a prominent World Bank (2013) study, only 13 of 101 middle-income countries succeeded in achieving high-income status between 1960 and 2011. The remaining countries—primarily located in Latin America and Asia—were “caught” in the MIR for more than half a century. Moreover, especially since China’s economic downturn, the question of whether the country is also at risk of an MIT has entered the political debate. For example, Li Keqiang mentioned it at the 12th National People's Congress in March 2016, and one year earlier, then Finance Minister Lou Jiwei warned that China had a 50% chance of falling into an MIT.
In our paper (Glawe and Wagner, 2017a), we investigate whether China is or will be in the MIT. We base our analysis on the two major concepts identified in the literature. On the one hand, there are triggering factors that either accelerate or impede growth. On the other hand, the literature also proposes various empirical definitions with which it can be determined whether a country is “trapped.” We discuss to which extent these two concepts are appropriate for identifying an MIT in China. In particular, we not only survey the recent literature, but also make our own MIT forecasts and analyze under which conditions China could be caught in an MIT. We also elaborate on the main weaknesses of the MIT concept. Most important, we find that the arbitrary nature of the MIR threshold choices has strong implication for the question of whether a country is identified as an MIT country.
Empirical definition approach
Empirical MIT definitions can be broken down into absolute and relative definitions. The former are based on absolute middle-income thresholds, whereas the latter refer to the GDP per capita relative to a developed country— the U.S. in most cases (see Figure 1 for graphical illustrations).
Figure 1: Graphical illustration of the absolute and relative definition approach
a) Absolute definition approach
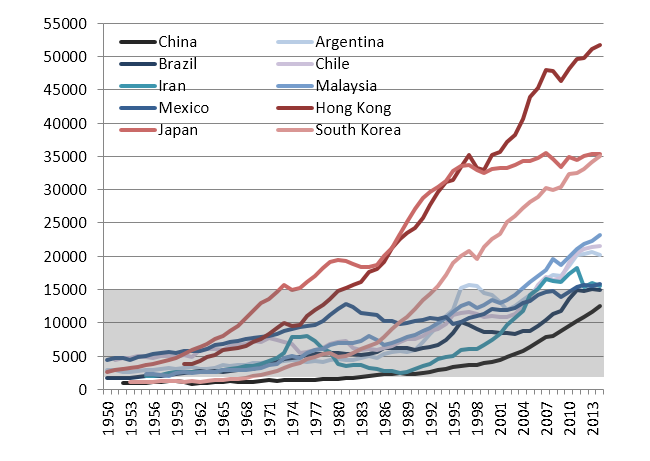
b) Relative definition approach
a) Absolute definition approach
b) Relative definition approach
Note: Updated version of Figure 3 in Glawe and Wagner (2016). Figure a: shows PPP adjusted GDP per capita in 2011 in U.S. dollars; the grey shaded area illustrates (an example of) the MIR, in particular, the Aiyar et al. (2013) middle-income thresholds. Figure b shows percentage of GDP per capita relative to the U.S.; the shaded area denotes the MIT countries (according the World Bank, 2013, definition).
With the empirical definitions, we aim to answer two main questions. First, is China already in an MIT according to certain definitions, or, alternatively, has China succeeded in catching up to the advanced countries? Second, will China become trapped in the future according to certain definitions, or, alternatively, will China be able to surpass the MIR in a timely manner? We apply the different MIT definitions to China, extend the data with various databases and database versions, and use projections to make MIT forecasts. In particular, we use the absolute MIT definitions of Eichengreen et al. (2012, 2014) and Felipe et al. (2012, 2017) as well as the relative definitions of the World Bank (2013), Woo et al. (2012), and Bulman et al. (2014). The majority of definitions used by these authors refers to an MIT period that is longer than 40 to 50 years; however, the middle-income thresholds differ significantly across studies: For example, the World Bank (2013) defines the MIR as ca. 4.5%-45% of US per capita income, Woo et al. (2012) as 20%-55%, and Bulman et al. (2014) as 10%-50%.
For the growth forecasts, we use the projections of the Conference Board (2010, pessimistic scenario), OECD (2012), World Bank (2013), Bailliu et al. (2014), Albert et al. (2015), Zhang et al. (2015), and the World Economic Outlook April 2016 forecast of the IMF. A detailed discussion of our various scenarios is provided in our paper.
Our main findings can be summarized as follows. Depending on which definition, database, and growth projections we use, we can find empirical support for all possible cases: China is (or is not) in an MIT and it will (or will not) fall into in the MIT (see also Figure 2). Thus, it is relatively easy to generate a “desired outcome.”
Figure 2: Implications of the different definitions for the question of whether China is in or will face an MIT
However, there are some consistencies: The majority of our scenarios imply that China is not yet in an MIT. Moreover, in most of our scenarios, China is or soon will be in the MIR but not caught in an MIT (the World Bank, 2013, definition is the only exception). Indeed, China will only enter an MIT if the growth rate drops to the levels predicted by the most pessimistic scenarios in the literature, that is, 3–4%. Overall, our analysis yields slightly optimistic results regarding China with respect to the definition approach.
Finally, we elaborate on the main weaknesses of the empirical definitions. Besides the standard problems associated with cross-country growth regressions, there are several other rather conceptual problems. The main point of criticism is that the middle-income thresholds differ considerably across studies. This can have significant impacts on the MIT results (i.e., on the question of whether a country is identified as an MIT country). The GDP data discrepancy across databases and across different versions of databases is another important problem that is a further source of ambiguity in the results of the definition approach.
Triggering factor approach
Regarding the triggering factor approach, we perform a meta-analysis of the general literature on the MIT. In total, there are about 18 factors that are considered pertinent for identifying a prolonged growth slowdown at the MIR. In our paper, we classify these factors into several (sub)groups to allow for a clearer overview on a more aggregated level. In particular, we differentiate between monetary/macroeconomic factors, real economy/production factors, institutions, financial markets, and inequality (see Figure 3).
Figure 3: Classification of the triggering factors
In general, China’s progress regarding these indicators is mixed. In the following, we briefly present the development of the most important indices in China (an extensive discussion can be found in our paper).
On the one hand, the export situation looks promising. Important indicators such as the share of hightech exports in GDP and the EXPY index (capturing the sophistication of a country’s export basket) indicate that China performs very well in cross-country comparison. Studies focusing on the EXPY index even state that China’s performance is better than what would be expected considering its GDP per capita. Figure 4 illustrates China’s steadily improving export sophistication and its strong catching up tendency.
Figure 4: China’s EXPY index compared to the East Asian Success Countries and the U.S.
Note: “EA Successes Ø” stands for the average of the Asian success countries (South Korea, Japan, Singapore, and Hong Kong); “EA MIC Ø” and “LA MIC Ø” depict the average of some East Asian middle-income countries (Malaysia, the Philippines, and Thailand) and, respectively, of some Latin American middle-income countries (Brazil, Peru, Bolivia, and Mexico) that are considered as MIT countries by various empirical studies.
On the other hand, improvements with respect to the human capital and education seem necessary. We start with some quantitative indicators, specifically, the percentage of the population that has completed secondary and tertiary education (see Figure 5). Although there have been improvements regarding these indicators (especially since the (mid-1980s), the stagnation (or even negative) trends since the 2000s and the low levels and slow growth of tertiary education in cross-country comparison are worrisome (China still lags behind even various Latin American and East Asian MIT countries).
Figure 5: Percentage of the population with completed secondary and tertiary education
Note: Completed secondary or tertiary education is expressed in % of the total population aged 15 and older. Abbreviations are defined as described in the Notes of Figure 4.
Regarding the qualitative aspect, although the PISA data indicate that China performs very well, these results should be treated with caution as only Shanghai, China is covered in this study. Finally, insufficient access to education for rural and rural-urban migrant children and the corresponding widening rural-urban human capital gap (depicted by Figure 6) could have serious negative impacts on the quality of large parts of the future labor supply.
Figure 6: Rural-urban human capital gap
It is much harder to evaluate China’s performance regarding productivity, mainly because TFP estimates differ strongly across studies. However, in general, there has been a gradual decrease in productivity in the last two decades. This can be partly attributed to the fact that in the course of structural change, China is currently confronted with the beginning of deindustrialization. In the coming years, the service sector will become by far the greatest sector of the Chinese economy; however, the service sector is generally characterized by slower productivity growth compared to the manufacturing sector that has (among others) driven China’s growth in recent years (see Glawe and Wagner, 2017b). Thus, future reforms should also focus on improving productivity in the service sector.
According to our analysis, China definitely has the potential to further catch up to high-income countries and to avoid an MIT. However, the future performance of the Chinese economy depends on further reforms initiated by China’s policy makers, especially regarding improvements in (service sector) TFP growth and human capital accumulation.
[Linda Glawe, Center for East Asia Macroeconomic Studies (CEAMeS) and University of Hagen; Helmut Wagner, Center for East Asia Macroeconomic Studies (CEAMeS) and University of Hagen.]
Aiyar, S., R. Duval, D. Puy, Y. Wu, and L. Zhang. 2013. Growth Slowdowns and the Middle-Income Trap. IMF Working Paper 13/71. Washington, DC: International Monetary Fund.
Albert, M., C. Jude, and C. Rebillard. 2015. The Long Landing Scenario: Rebalancing from Overinvestment and Excessive Credit Growth, and Implications for Potential Growth in China. Banque de France, Working Paper No. 572. Paris: Banque de France.
Bailliu, J., M. Kruger, A. Toktamyssov, and W. Welbourn. 2014. What’s Driving Economic Growth in China? Accounting for Overinvestment, Housing and Human Capital. Mimeo, Bank of Canada.
Bulman, D., M. Eden, and H. Nguyen. 2014. Transitioning from Low-Income Growth to High-Income Growth—Is There a Middle Income Trap? Policy Research Working Paper No. 7104. Washington, DC: World Bank.
Conference Board. 2010. Global Economic Outlook 2011. New York: Conference Board.
Eichengreen, B., D. Park, and K. Shin. 2012. When Fast-Growing Economies Slow Down: International Evidence and Implications for China. Asian Economic Papers 11(1): 42–87.
Eichengreen, B., D. Park, and K. Shin. 2014. Growth Slowdowns Redux. Japan and the World Economy 32: 65–84.
Felipe, J., A. Abdon, and U. Kumar. 2012. Tracking the Middle-Income Trap: What is it, Who is in it, and Why? Levy Economics Institute of Bard College, Working Paper No. 715. Annandale-on-Hudson, NY: Levy Economics Institute.
Felipe, J., U. Kumar, and R. Galope. 2017. Middle-Income Transitions: Trap or Myth? Journal of the Asia Pacific Economy 22(3): 429-53.
Gill, I., and H. Kharas, 2007: An East Asian Renaissance—Ideas for Economic Growth. World Bank: Washington, DC.
Glawe, L. and H. Wagner. 2016. The Middle-Income Trap: Definitions, Theories and Countries Concerned—A Literature Survey. Comparative Economic Studies 58(4): 507–538.
Glawe, L. and H. Wagner. 2017a. The People’s Republic of China in the Middle-Income Trap? ADBI Working Paper No. 749. Tokyo: Asian Development Bank Institute (ADBI).
Glawe, L. and H. Wagner. 2017b. A Stylized Model of China’s Growth Since 1978. SSRN Working Paper No. 2917433 and CEAMeS Discussion Paper No. 5. Hagen: Center for East Asia Macroeconomic Studies.
OECD. 2012. Looking to 2060: Long-Term Global Growth Prospects. OECD Economic Policy Papers No. 03. Paris: OECD Publishing.
OECD. 2015. OECD Economic Surveys: China. Paris: OECD Publishing.
Woo, W. T., M. Lu, J. D. Sachs, and Z. Chen. 2012. A New Economic Growth Engine for China: Escaping the Middle-Income Trap by Not Doing More of the Same. Singapore: World Scientific Publishing Company. London: Imperial College Press.
World Bank. 2013. China 2030: Building a Modern, Harmonious, and Creative High-Income Society. Washington, DC: World Bank.
Zhang, J., L. Xu, and F. Liu. 2015. The Future is in the Past: Projecting and Plotting the Potential Rate of Growth and Trajectory of the Structural Change of the Chinese Economy for the Next 20 Years. China & World Economy 23(1): 21–46.

Latest
Most Popular
- VoxChina Covid-19 Forum (Second Edition): China’s Post-Lockdown Economic Recovery VoxChina, Apr 18, 2020
- China’s Great Housing Boom Kaiji Chen, Yi Wen, Oct 11, 2017
- China’s Joint Venture Policy and the International Transfer of Technology Kun Jiang, Wolfgang Keller, Larry D. Qiu, William Ridley, Feb 06, 2019
- The Dark Side of the Chinese Fiscal Stimulus: Evidence from Local Government Debt Yi Huang, Marco Pagano, Ugo Panizza, Jun 28, 2017
- Wealth Redistribution in the Chinese Stock Market: the Role of Bubbles and Crashes Li An, Jiangze Bian, Dong Lou, Donghui Shi, Jul 01, 2020
- Evaluating Risk across Chinese Housing Markets Yongheng Deng, Joseph Gyourko, Jing Wu, Aug 02, 2017
- What Is Special about China’s Housing Boom? Edward L. Glaeser, Wei Huang, Yueran Ma, Andrei Shleifer, Jun 20, 2017
- Privatization and Productivity in China Yuyu Chen, Mitsuru Igami, Masayuki Sawada, Mo Xiao, Jan 31, 2018
- How did China Move Up the Global Value Chains? Hiau Looi Kee, Heiwai Tang, Aug 30, 2017
- China’s Shadow Banking Sector: Wealth Management Products and Issuing Banks Viral V. Acharya, Jun Qian, Zhishu Yang, Aug 09, 2017


