A Bridge on Economic Issues between China and the World


 Facebook
  Twitter
  Instagram
 WeChat
  Email
Email Daily Price Limits and the Magnet Effect

We find that the widely adopted daily price limit rules may induce large investors as a group to pursue a destructive trading strategy of pushing stock prices to the upper price limit and then profiting from selling these stocks on the next day. Their trading accelerates the price increase on the day that the upper price limit is reached, thus leading to the so-called Magnet Effect. This unintended effect renders the daily price limits — a market stabilization scheme — counterproductive.
Daily price limit rules are widely used by stock markets across the globe and are particularly popular in emerging markets with a large body of inexperienced investors. As the daily price limit provides a time-out period during large price fluctuations, they are viewed as a market stabilization mechanism. China’s equity market also imposes daily price limits of 10 percent on regular stocks and 5 percent on special treatment (ST) stocks. Do daily price limits stabilize the markets? This remains an open question despite the popularity of daily price limits among the world’s equity markets.
Some critics have pointed out that the price limit rules may impede the price discovery process, interfere with trading, and induce an order imbalance and volatility spillover (e.g., Kim and Rhee, 1997; Chan, Kim, and Rhee, 2005). Prior studies have also documented the so-called “Magnet Effect,” which is a curious tendency for stock prices to accelerate toward the upper price limit and a similar albeit weaker tendency toward the lower limit as prices approach these thresholds (e.g., Cho et al., 2003; Hsieh et al., 2009). What force generates this Magnet Effect?
Our recent study, “Daily Price Limits and Destructive Market Behavior,” offers some insights on these questions by analyzing the effects of daily price limits in China’s A-share markets. Our analysis focuses on a popular strategy, which is often discussed in the news media and also observed in some market enforcement cases, of certain speculators pushing up stock prices to the upper price limit and then profiting by selling these stocks on the next day. Specifically, we examine account-level data from the Shenzhen Stock Exchange, by pooling investors into six groups. One is the institution group, which includes all institutions. Then there are five individual investor groups classified by their average stock balance in the previous year: 1) Less than 100 thousand RMB; 2) Between 100 thousand and 500 thousand RMB; 3) Between 500 thousand and 5 million RMB; 4) Between 5 million and 10 million RMB; and 5) Larger than 10 million RMB. The group of large investors — those investors who have an average stock balance of over 10 million RMB — is particularly interesting because large investors tend to be more sophisticated and also the speculators involved in the news media coverage concerning the upper price limit strategy tend to be large investors.
Figure 1 plots the NetBuy of different groups of investors on the day a stock hits its upper price limit (day 0) and the following day (day 1), measured by the net buy of a stock by each group on a given day denominated by the stock’s floating shares. For comparison, we also plot the NetBuy by different investor groups on trading days with large closing returns in (8%, 9%) and (9%, 10%), which we hereafter refer to simply as having 8 percent and 9 percent returns, respectively.
Figure 1 shows a clear and distinctive strategy used by large investors in the middle panel of the bottom row. They purchase the stocks that hit the upper price limit on day 0 and sell them on day 1. As a group, they acquire 0.69 percent of the stock’s floating shares on day 0 and sell 0.51 percent on day 1. These quantities are comparable to the average daily turnover rate of 3.1 percent of regular stocks traded on the exchange and are particularly large relative to the group’s average turnover of 0.44 percent. While the group trades in the same manner on days with large interior closing returns of 8 percent or 9 percent, their net buy on day 0 and net sell on day 1 are substantially lower than on those days when the upper price limit is reached. This pattern of large investors quickly reversing their buying positions on the next day is peculiar and does not follow a positive-feedback strategy.
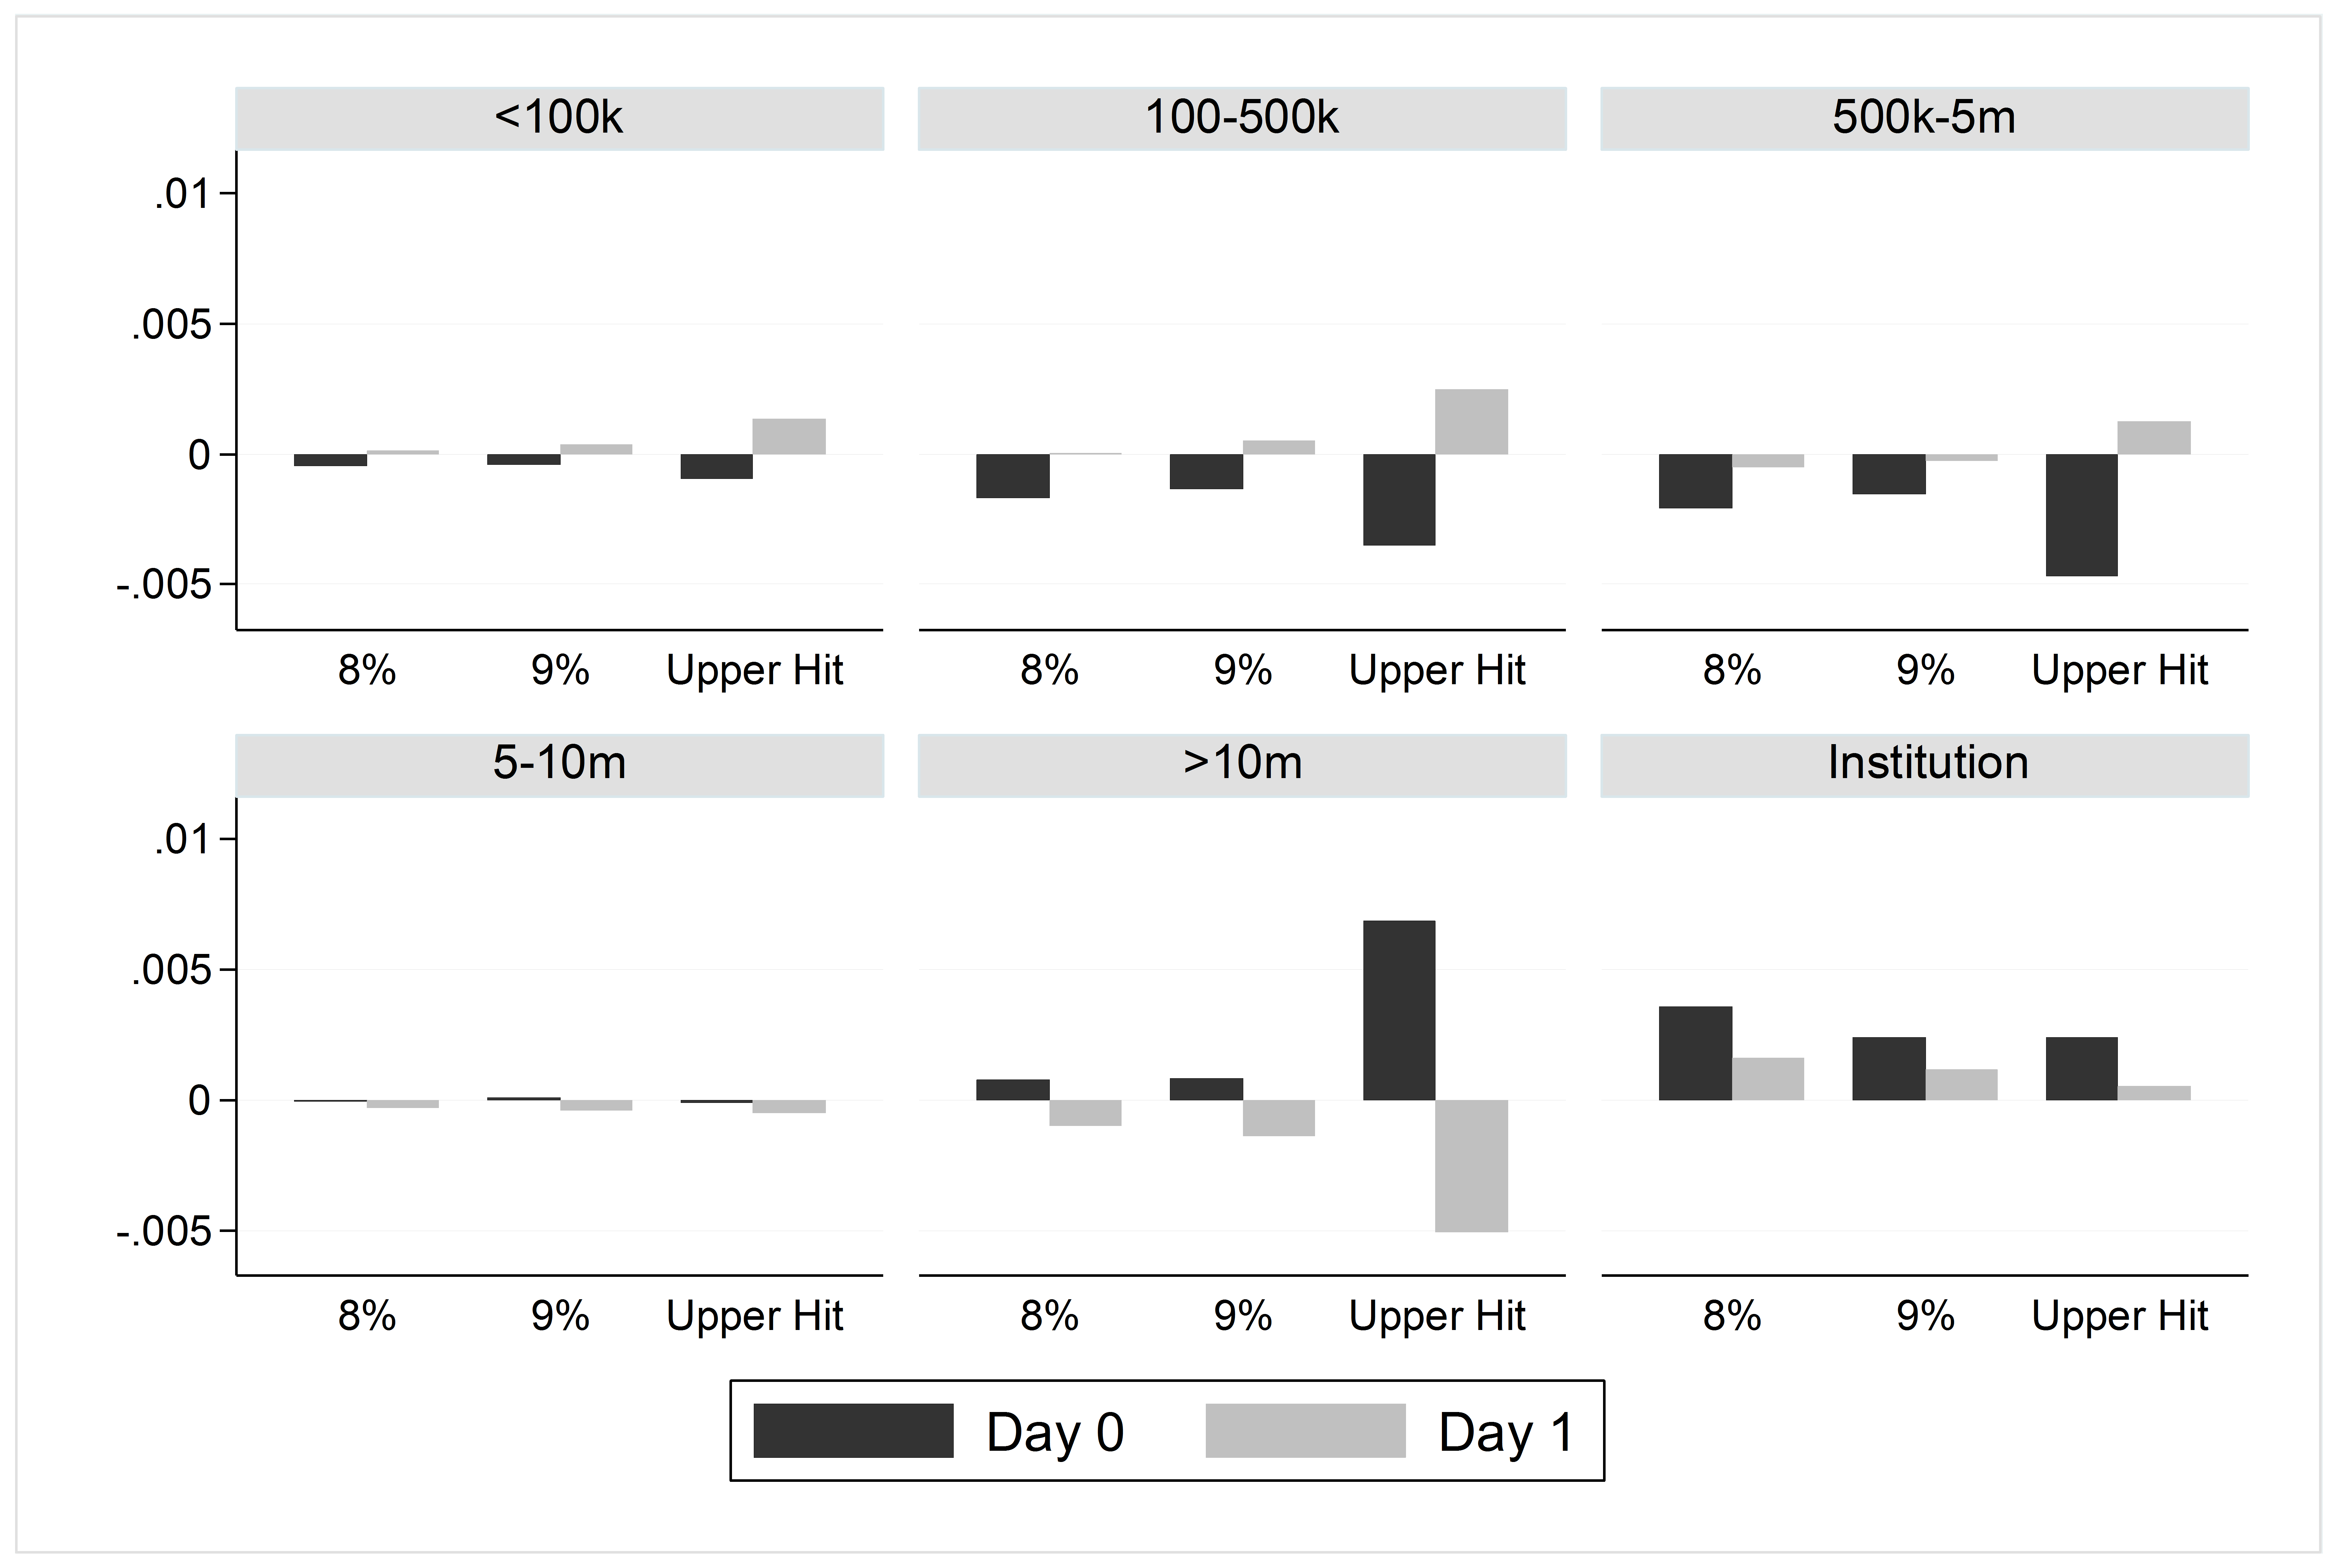
Notes: This figure plots the NetBuy of different investor groups on the day the upper price limit is reached (Day 0) and the following day (Day 1) of large price fluctuations.
In contrast, small and median investors in the three groups with average stock balances lower than 5 million RMB all exhibit the opposite trading pattern — their NetBuy is negative on day 0 while positive on day 1 after the upper price limit is reached. The intermediate investor group with stock balances between 5 and 10 million RMB does not buy or sell any notable amount of stocks around the upper price limit-hitting days and large return days. The institution group acquires stocks on both day 0 and day 1 around these events (See Note 1).
Motivated by the peculiar pattern in the NetBuy of large investors, we test a central hypothesis that large investors push stocks that experience large price increases during a trading day to close at the upper price limit and then profit from selling at higher prices on the next day and, furthermore, their destructive trading behavior causes stock prices to overreact to the initial price shocks. Figure 1 already confirms the first part of this hypothesis. Furthermore, we find that after a stock hits the 10 percent upper price limit, its price continues to rise on the next day and the price increase eventually reverses in the long-run. Interestingly, the price increase occurs only after the stock hits the 10 percent price limit, mostly at the open price of the next day, but does not increase after having a large daily return just below 10 percent. This pattern of continued price increase followed by a long-run reversal indicates price overreactions around the upper price limit-hitting events. Motivated by this observed price pattern, we test the second part of our hypothesis by using the NetBuy of large investors on the limit-hitting day to predict the long-run price reversal. Indeed, we find strong evidence confirming our hypothesis. Overall, these findings paint a clear picture that large investors as a group pursue a destructive strategy around the upper price limit-hitting days and their trading has a significant market impact. To the extent that their large net buy on the days of when the upper price limit is reached actually accelerates the price increase and their destructive trading behavior leads to the aforementioned Magnet Effect.
To further separate the effect of the daily price limit rule from an alternative mechanism of large investors simply front-running feedback traders on days of large price fluctuations, we also examine a sample of 119 stocks that were assigned ST status by the Shenzhen Stock Exchange in 2012–2015. These ST stocks face tighter 5 percent daily price limits. In general, ST status is given to a publicly listed firm if it reports negative profits for two consecutive years or a net asset value below the par value. While ST status is announced by the exchange only after a firm formally releases its annual financial report, the market can well anticipate the ST assignment immediately after the firm reports its eighth consecutive negative quarterly earnings or a low net asset value, which is usually two or three months ahead of the release of its annual report. During this interim period, the market anticipates that the firm will eventually be labeled as ST but its stock is currently still trading under the regular 10 percent price limits.
By taking advantage of this period, we find several results induced by the more restrictive 5 percent price limits after the ST status is officially assigned. First, after the assignment of ST status, the long-run price reversal subsequent to days when the 5 percent price limit is reached becomes more pronounced when compared to the long-run price reversal subsequent to the days when there are large daily returns above 5 percent in the pre-ST period. Second, the trading of large investors displays the familiar pattern of buying on the day the upper price limit is reached and selling on the next day after the ST assignment (but not before). Third, after the assignment of ST status, the net buying of large investors on the days the price limit is reached has a stronger predictive power of the subsequent long-run price reversal. These findings thus specifically demonstrate that the tighter price limits of ST stocks exacerbate the destructive trading behavior of large investors around days with returns above 5 percent and the large investors’ trading is associated with price overreactions on these days.
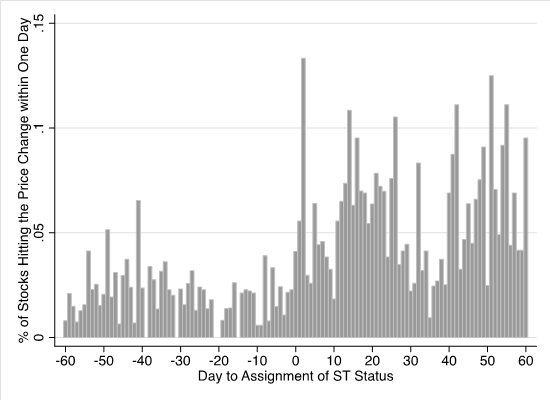
Notes: This figure shows the fraction of stocks with daily returns larger than 4 percent 60 days before and after the assignment of ST status for 119 stocks.
Finally, we give a visual illustration of the change in price volatility before and after the assignment of ST status. Specifically, Figure 2 depicts the fraction of the 119 ST stocks in our sample on a given day with large daily returns above 4 percent for 60 trading days before and after day 0 — when each stock was officially assigned its ST status. The figure shows a visible increase in this fraction in the post-ST period. This increase highlights the effect of the tighter daily price limit on price volatility — the destructive trading behavior of large investors induced by the tighter daily price limit makes the occurrence of large daily returns above 4 percent more frequent rather than less frequent. Admittedly, the cutoff choice of 4 percent is ad hoc. We choose a cutoff lower than 5 percent because large investors pursue a destructive trading strategy not only on days when the 5 percent price limit is reached but also on days with large returns close to the price limit.
Overall, our analysis provides a set of empirical findings to show that the widely-adopted daily price limit rules may induce large investors as a group to pursue a destructive trading strategy of pushing stock prices to the upper price limit and then profit from selling these stocks on the next day. Their trading accelerates the price increase on the day the upper price limit is reached, thus leading to a Magnet Effect. This unintended effect highlights the challenge in designing a trading system for emerging equity markets, which tend to have a mix of experienced and inexperienced investors. Their different trading behaviors may render a market stabilization scheme, such as one having daily price limits, counterproductive.
Note 1: We have also examined the NetBuy of different investor groups on day 0 and day 1 of hitting the lower price limit and having large negative returns in (-9.99%, -9%) and (-8.99%, -8%). We find that the largeinvestor group does not pursue any destructive strategy around these days — they tend to sell a large quantity on day 0 and then continue to sell another smaller quantity on day 1. This observation is consistent with the argument that the difficulty of short-selling stocks makes pursuing a destructive strategy around the lower price limit-hitting events undesirable.
Chan, Soon Huat, Kenneth A. Kim, and S. Ghon Rhee (2005). “Price Limit Performance: Evidence from Transactions Data and the Limit Order Book,” Journal of Empirical Finance 12(2): 269-290.
Chen, Ting, Zhenyu Gao, Jibao He, Wenxi Jiang, and Wei Xiong (2017). “Daily Price Limits and Destructive Market Behavior,” working paper, Princeton University.
Cho, David D., Jeffrey Russell, George C. Tiao, and Ruey Tsay (2003). “The Magnet Effect of Price Limits: Evidence from High-frequency Data on Taiwan Stock Exchange,” Journal of Empirical Finance 10(1): 133-168.
Hsieh, Ping-Hung, Yong H. Kim, and J. Jimmy Yang (2009). “The Magnet Effect of Price Limits: A Logit Approach,” Journal of Empirical Finance 16(5): 830-837.
Daily price limit rules are widely used by stock markets across the globe and are particularly popular in emerging markets with a large body of inexperienced investors. As the daily price limit provides a time-out period during large price fluctuations, they are viewed as a market stabilization mechanism. China’s equity market also imposes daily price limits of 10 percent on regular stocks and 5 percent on special treatment (ST) stocks. Do daily price limits stabilize the markets? This remains an open question despite the popularity of daily price limits among the world’s equity markets.
Some critics have pointed out that the price limit rules may impede the price discovery process, interfere with trading, and induce an order imbalance and volatility spillover (e.g., Kim and Rhee, 1997; Chan, Kim, and Rhee, 2005). Prior studies have also documented the so-called “Magnet Effect,” which is a curious tendency for stock prices to accelerate toward the upper price limit and a similar albeit weaker tendency toward the lower limit as prices approach these thresholds (e.g., Cho et al., 2003; Hsieh et al., 2009). What force generates this Magnet Effect?
Our recent study, “Daily Price Limits and Destructive Market Behavior,” offers some insights on these questions by analyzing the effects of daily price limits in China’s A-share markets. Our analysis focuses on a popular strategy, which is often discussed in the news media and also observed in some market enforcement cases, of certain speculators pushing up stock prices to the upper price limit and then profiting by selling these stocks on the next day. Specifically, we examine account-level data from the Shenzhen Stock Exchange, by pooling investors into six groups. One is the institution group, which includes all institutions. Then there are five individual investor groups classified by their average stock balance in the previous year: 1) Less than 100 thousand RMB; 2) Between 100 thousand and 500 thousand RMB; 3) Between 500 thousand and 5 million RMB; 4) Between 5 million and 10 million RMB; and 5) Larger than 10 million RMB. The group of large investors — those investors who have an average stock balance of over 10 million RMB — is particularly interesting because large investors tend to be more sophisticated and also the speculators involved in the news media coverage concerning the upper price limit strategy tend to be large investors.
Figure 1 plots the NetBuy of different groups of investors on the day a stock hits its upper price limit (day 0) and the following day (day 1), measured by the net buy of a stock by each group on a given day denominated by the stock’s floating shares. For comparison, we also plot the NetBuy by different investor groups on trading days with large closing returns in (8%, 9%) and (9%, 10%), which we hereafter refer to simply as having 8 percent and 9 percent returns, respectively.
Figure 1 shows a clear and distinctive strategy used by large investors in the middle panel of the bottom row. They purchase the stocks that hit the upper price limit on day 0 and sell them on day 1. As a group, they acquire 0.69 percent of the stock’s floating shares on day 0 and sell 0.51 percent on day 1. These quantities are comparable to the average daily turnover rate of 3.1 percent of regular stocks traded on the exchange and are particularly large relative to the group’s average turnover of 0.44 percent. While the group trades in the same manner on days with large interior closing returns of 8 percent or 9 percent, their net buy on day 0 and net sell on day 1 are substantially lower than on those days when the upper price limit is reached. This pattern of large investors quickly reversing their buying positions on the next day is peculiar and does not follow a positive-feedback strategy.
Figure 1: Trading around Days with Large Price Fluctuations by Investor Groups
In contrast, small and median investors in the three groups with average stock balances lower than 5 million RMB all exhibit the opposite trading pattern — their NetBuy is negative on day 0 while positive on day 1 after the upper price limit is reached. The intermediate investor group with stock balances between 5 and 10 million RMB does not buy or sell any notable amount of stocks around the upper price limit-hitting days and large return days. The institution group acquires stocks on both day 0 and day 1 around these events (See Note 1).
Motivated by the peculiar pattern in the NetBuy of large investors, we test a central hypothesis that large investors push stocks that experience large price increases during a trading day to close at the upper price limit and then profit from selling at higher prices on the next day and, furthermore, their destructive trading behavior causes stock prices to overreact to the initial price shocks. Figure 1 already confirms the first part of this hypothesis. Furthermore, we find that after a stock hits the 10 percent upper price limit, its price continues to rise on the next day and the price increase eventually reverses in the long-run. Interestingly, the price increase occurs only after the stock hits the 10 percent price limit, mostly at the open price of the next day, but does not increase after having a large daily return just below 10 percent. This pattern of continued price increase followed by a long-run reversal indicates price overreactions around the upper price limit-hitting events. Motivated by this observed price pattern, we test the second part of our hypothesis by using the NetBuy of large investors on the limit-hitting day to predict the long-run price reversal. Indeed, we find strong evidence confirming our hypothesis. Overall, these findings paint a clear picture that large investors as a group pursue a destructive strategy around the upper price limit-hitting days and their trading has a significant market impact. To the extent that their large net buy on the days of when the upper price limit is reached actually accelerates the price increase and their destructive trading behavior leads to the aforementioned Magnet Effect.
To further separate the effect of the daily price limit rule from an alternative mechanism of large investors simply front-running feedback traders on days of large price fluctuations, we also examine a sample of 119 stocks that were assigned ST status by the Shenzhen Stock Exchange in 2012–2015. These ST stocks face tighter 5 percent daily price limits. In general, ST status is given to a publicly listed firm if it reports negative profits for two consecutive years or a net asset value below the par value. While ST status is announced by the exchange only after a firm formally releases its annual financial report, the market can well anticipate the ST assignment immediately after the firm reports its eighth consecutive negative quarterly earnings or a low net asset value, which is usually two or three months ahead of the release of its annual report. During this interim period, the market anticipates that the firm will eventually be labeled as ST but its stock is currently still trading under the regular 10 percent price limits.
By taking advantage of this period, we find several results induced by the more restrictive 5 percent price limits after the ST status is officially assigned. First, after the assignment of ST status, the long-run price reversal subsequent to days when the 5 percent price limit is reached becomes more pronounced when compared to the long-run price reversal subsequent to the days when there are large daily returns above 5 percent in the pre-ST period. Second, the trading of large investors displays the familiar pattern of buying on the day the upper price limit is reached and selling on the next day after the ST assignment (but not before). Third, after the assignment of ST status, the net buying of large investors on the days the price limit is reached has a stronger predictive power of the subsequent long-run price reversal. These findings thus specifically demonstrate that the tighter price limits of ST stocks exacerbate the destructive trading behavior of large investors around days with returns above 5 percent and the large investors’ trading is associated with price overreactions on these days.
Figure 2: Distribution of Large Daily Returns Before and After ST Assignment
Finally, we give a visual illustration of the change in price volatility before and after the assignment of ST status. Specifically, Figure 2 depicts the fraction of the 119 ST stocks in our sample on a given day with large daily returns above 4 percent for 60 trading days before and after day 0 — when each stock was officially assigned its ST status. The figure shows a visible increase in this fraction in the post-ST period. This increase highlights the effect of the tighter daily price limit on price volatility — the destructive trading behavior of large investors induced by the tighter daily price limit makes the occurrence of large daily returns above 4 percent more frequent rather than less frequent. Admittedly, the cutoff choice of 4 percent is ad hoc. We choose a cutoff lower than 5 percent because large investors pursue a destructive trading strategy not only on days when the 5 percent price limit is reached but also on days with large returns close to the price limit.
Overall, our analysis provides a set of empirical findings to show that the widely-adopted daily price limit rules may induce large investors as a group to pursue a destructive trading strategy of pushing stock prices to the upper price limit and then profit from selling these stocks on the next day. Their trading accelerates the price increase on the day the upper price limit is reached, thus leading to a Magnet Effect. This unintended effect highlights the challenge in designing a trading system for emerging equity markets, which tend to have a mix of experienced and inexperienced investors. Their different trading behaviors may render a market stabilization scheme, such as one having daily price limits, counterproductive.
Note 1: We have also examined the NetBuy of different investor groups on day 0 and day 1 of hitting the lower price limit and having large negative returns in (-9.99%, -9%) and (-8.99%, -8%). We find that the largeinvestor group does not pursue any destructive strategy around these days — they tend to sell a large quantity on day 0 and then continue to sell another smaller quantity on day 1. This observation is consistent with the argument that the difficulty of short-selling stocks makes pursuing a destructive strategy around the lower price limit-hitting events undesirable.
(Ting Chen, Bendheim Center of Finance, Princeton University; Zhenyu Gao, the Chinese University of Hong Kong (CUHK) Business School; Jibao He, the Research Institute of the Shenzhen Stock Exchange; Wenxi Jiang, the Chinese University of Hong Kong (CUHK) Business School; Wei Xiong, Department of Economics, Princeton University.)
Chan, Soon Huat, Kenneth A. Kim, and S. Ghon Rhee (2005). “Price Limit Performance: Evidence from Transactions Data and the Limit Order Book,” Journal of Empirical Finance 12(2): 269-290.
Chen, Ting, Zhenyu Gao, Jibao He, Wenxi Jiang, and Wei Xiong (2017). “Daily Price Limits and Destructive Market Behavior,” working paper, Princeton University.
Cho, David D., Jeffrey Russell, George C. Tiao, and Ruey Tsay (2003). “The Magnet Effect of Price Limits: Evidence from High-frequency Data on Taiwan Stock Exchange,” Journal of Empirical Finance 10(1): 133-168.
Hsieh, Ping-Hung, Yong H. Kim, and J. Jimmy Yang (2009). “The Magnet Effect of Price Limits: A Logit Approach,” Journal of Empirical Finance 16(5): 830-837.
Kim, Kenneth A., and S. Ghon Rhee (1997). “Price Limit Performance: Evidence from the Tokyo Stock Exchange,” Journal of Finance 52(2): 885-901.

Latest
Most Popular
- VoxChina Covid-19 Forum (Second Edition): China’s Post-Lockdown Economic Recovery VoxChina, Apr 18, 2020
- China’s Joint Venture Policy and the International Transfer of Technology Kun Jiang, Wolfgang Keller, Larry D. Qiu, William Ridley, Feb 06, 2019
- China’s Great Housing Boom Kaiji Chen, Yi Wen, Oct 11, 2017
- Wealth Redistribution in the Chinese Stock Market: the Role of Bubbles and Crashes Li An, Jiangze Bian, Dong Lou, Donghui Shi, Jul 01, 2020
- The Dark Side of the Chinese Fiscal Stimulus: Evidence from Local Government Debt Yi Huang, Marco Pagano, Ugo Panizza, Jun 28, 2017
- What Is Special about China’s Housing Boom? Edward L. Glaeser, Wei Huang, Yueran Ma, Andrei Shleifer, Jun 20, 2017
- Privatization and Productivity in China Yuyu Chen, Mitsuru Igami, Masayuki Sawada, Mo Xiao, Jan 31, 2018
- How did China Move Up the Global Value Chains? Hiau Looi Kee, Heiwai Tang, Aug 30, 2017
- Evaluating Risk across Chinese Housing Markets Yongheng Deng, Joseph Gyourko, Jing Wu, Aug 02, 2017
- China’s Shadow Banking Sector: Wealth Management Products and Issuing Banks Viral V. Acharya, Jun Qian, Zhishu Yang, Aug 09, 2017


