A Bridge on Economic Issues between China and the World


 Facebook
  Twitter
  Instagram
 WeChat
  Email
Email US–China Tensions

We construct a US–China Tensions index (UCT) and examine its economic transmission effects. The index spikes notably around the 2008 unrest in Tibet and the China military buildup, the 2018 arrest of a Huawei executive, and the 2018–2019 trade disputes. The index reaches its peak at the onset of the 2020 global pandemic. We interpret such tension as reflecting both the realization of new barriers between the two countries and the risk of existing barriers escalating. We show that heightened US–China Tension has adverse economic effects at both the aggregate and firm levels, including protracted output declines, increased credit spreads, lower bilateral trade, and reduced firm-level investment, R&D, and hiring.

Since 1949, US–China relations have evolved from tense standoffs to a complex mix of intensifying diplomacy, growing international rivalry, and increasingly intertwined economies. Continued escalation of trade disputes and blame over the spread of the coronavirus are emblematic of a significant hardening of positions. US–China tensions extend well beyond trade and stem from a growing number of issues including information security, currency practices, technology innovation, and military buildup. Recent sources of tensions from the US perspective include COVID-19, unfair trade practices, currency manipulation, industrial espionage, Tik Tok, free speech, Hong Kong, and Uyghurs. Tensions from China's perspective include tariffs, protectionism, military adventurism, meddling, guns, and race relations. Investors, corporate executives, and policymakers often cite US–China tension as an important determinant of economic decisions. However, the importance of US–China tension in shaping either macroeconomic outcomes or firm-level decisions over a long time span has not been studied empirically. The main limitation has been the lack of an indicator that can quantify the intensity of US–China bilateral tension and is available consistently over time.
In Rogers, Sun, and Webster (2021), we measure the intensity of public concerns over US–China tension (UCT) and quantify its economic consequences. US–China tension has been frequently mentioned in commentaries as a major factor in economic decisions, as it induces risks associated with increased barriers that disrupt bilateral transactions. To our knowledge, our index is the first to quantify the intensity of bilateral tension between the US and China over time.
Our approach to constructing the UCT index is to track the frequency of newspaper articles related to US–China tension. We augment the search-based textual analysis pioneered by Baker, Bloom, and Davis (2016) with machine learning techniques. Through this, we determine the search terms by identifying likely relevant, frequently occurring words in a large set of manually identified articles that discuss increased tension, taking into account the hidden structure or intrinsic characteristics of text data. Using the ProQuest Newsstand and historical archives, we search for articles containing the mention of (i) United States (or US or Washington) and China (or Beijing or Chinese), (ii) contentious issues in the bilateral relationship, and (iii) phrases indicating confrontation. We do this for every day's issue of the following newspapers: the Boston Globe, the Chicago Tribune, the Dallas Morning News, the Los Angeles Times, the Miami Herald, the New York Times, the San Francisco Chronicle, USA Today, the Wall Street Journal, and the Washington Post.
US–China Tensions Index
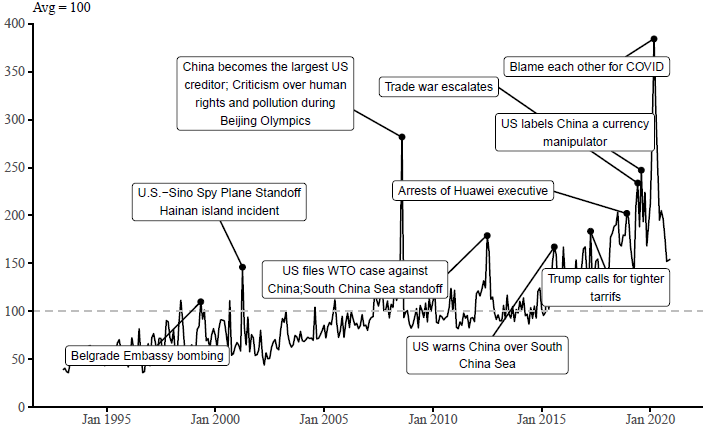
The UCT index, shown in Figure 1, spikes around the US bombing of the Chinese embassy in Belgrade in 1999 and the 2001 Hainan Island incident and US–Sino spy plane standoff. The index spikes notably in 2008, related to unrest in Tibet, the Xinjiang province separatists, China’s rapid military buildup, and China’s becoming America's largest foreign creditor in that year. An important conduit for these long-standing issues was found in Beijing's hosting the 2008 Summer Olympics. More recently, our index is elevated in December 2018 around the arrest of an executive from Huawei; in May and June 2019 during the high-profile raising of US tariffs on Chinese imports; and in September 2019 around US accusations that China was manipulating the Renminbi exchange rate and a proposal to ban Chinese IPOs in the US. Finally, the largest value of our index occurs in March 2020, coinciding with President Trump’s blaming China for the coronavirus outbreak in the US. We interpret such tension as reflecting both the realization of new barriers between the two countries and the risk of escalation for existing barriers; thus, we decompose these tensions into “actions” and “risks” in Rogers, Sun, and Webster (2021). The UCT index evolves over time from focusing on conflicts of a geopolitical nature toward being heavily related to the economy.
Figure 1: The US-China Tension Index
Transmission of UCT to the Aggregate US Economy
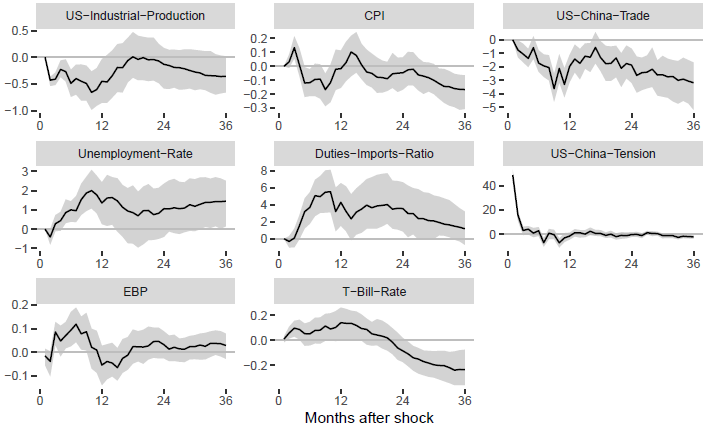
We quantify the aggregate effects of the UCT on economic outcomes using impulse response analysis estimated from vector autoregressions (VAR). The system includes the logs of US industrial production (IP) and the consumer price index (CPI), total US–China trade, a measure of effective US bilateral tariffs, the ratio of import duties to total imports, our UCT index, the one-year US Treasury bill rate, and the Gilchrist-Zakrajsek (2015) excess bond premium (EBP). The series are monthly, with a sample period of 1993:1 to 2019:12, and ordered in the VAR as listed above.
The impulse responses to a one standard deviation shock to UCT are displayed in Figure 2. Industrial output and inflation fall on impact and reach a trough in month 12. There is also a rise in the excess bond premium that is significant in the near-to-medium term, suggesting that borrowing costs rise in response to elevated tension. Unemployment rises significantly in the medium term, and the total volume of US–China trade falls persistently, by an amount (around 2%) that is statistically and economically significant.
Figure 2: IRF results from UCT shock
Channels: firm-level evidence
Conventional models predict that an increase in any risk, such as risks of elevated barriers that disrupt transactions between the US and China, should discourage firm investment and employment growth (e.g., Pindyck (1988); Bloom et al. (2007)). We examine how fluctuations in the UCT are transmitted to the real economy by using quarterly firm-level data from COMPUSTAT from 1993Q1 through 2019Q4, chosen to match the availability of our UCT index and avoid conflating the effects of COVID-19. Following Gulen and Ion (2015), we use a standard Q theory of investment model, adding lagged UCT, to estimate the average relationship between the UCT and firm investment. We find that heightened UCT significantly depresses firm investment, an effect that remains significant up to four quarters in the future. For example, we find that a one standard deviation increase in the UCT is associated with a decline of 0.08 standard deviations in firm investment in the next quarter. This is a decrease of 19 basis points, which is equivalent to 12.1% of the average investment level in the sample. We find similar negative responses in firm R&D, the major source of productivity growth, and in firm hiring. Specifically, a one standard deviation increase in the UCT is associated with a decrease of about 0.02 standard deviations in firm R&D, corresponding to economically large decreases of nearly 8% of its sample mean. Similarly, examining the relationship between firm employment and the UCT reveals a robust, strong negative association: a one standard deviation increase in the UCT is associated with a decrease of 0.1 standard deviations in firm hiring, which corresponds economically large decreases of nearly 5% of its sample mean.
In addition, we find that the negative response in capital investment to heightened UCT is not uniform in the cross-section. To the extent that elevated UCT weighs on aggregate demand and increases economic growth risks, firms in highly cyclical sectors are more vulnerable. Relatedly, increased risk and uncertainty can induce precautionary investment delays due to investment irreversibility (e.g., Abel and Eberly, 1996; Bernanke, 1983; Bertola and Caballero, 1994; Bloom, 2009; Caballero and Pindyck, 1996), and the financial frictions theory emphasizes that increased risk, seen as a mean-preserving spread in the distribution of future cash flows, indicates higher likelihoods of default and therefore higher costs of debt financing (Greenwald and Stiglitz, 1990; Gilchrist, Sim, and Zakrajsek, 2014). Consistently, we find that the negative investment response to the UCT is significantly stronger for firms in more cyclical industries, firms with a higher degree of investment irreversibility, and firms subject to greater financial constraints. Collectively, our results lend empirical support to the notion that elevated US–China tension depresses firm investment in ways that are consistent with increased economic growth risks. Taken together, these results suggest that firms respond negatively to the UCT in ways that are in line with increased economic growth risks. They are also consistent with Baker, Bloom, and Davis (2016), who document a negative relationship between their measure of aggregate economic policy uncertainty and firm-level investment rates and employment growth.
The views expressed herein are those of the authors and do not necessarily reflect the opinions of the Board of Governors of the Federal Reserve System.
(John Rogers is a Senior Adviser in the International Finance Division of the Federal Reserve Board; Bo Sun is a Principal Economist at the Federal Reserve Board; Chris Webster is a senior research assistant at the Federal Reserve Board.)
References
Abel, A. B. and Eberly, J. C., 1996. “Optimal Investment with Costly Reversibility,” The Review of Economic Studies, 63, 581–593.
Baker, S. R., Bloom, N. and Davis, S. J., 2016. “Measuring Economic Policy Uncertainty,” The Quarterly Journal of Economics, 131, 1593–1636.
Bertola, G. and Caballero, R. J., 1994. “Irreversibility and Aggregate Investment,” The Review of Economic Studies, 61, 223–246.
Bloom, N., 2009. “The Impact of Uncertainty Shocks,” Econometrica, 77, 623–685.
Caballero, R. J. and Pindyck, R. S., 1996. “Uncertainty, Investment, and Industry Evolution,” International Economic Review, 37, 641–662.
Gilchrist, S., Sim, J. W. and Zakrajsek, E., 2014. “Uncertainty, Financial Frictions, and Investment Dynamics (No. w20038),” National Bureau of Economic Research.
Gilchrist, S., Zakrajsek, E., 2012. “Credit Spreads and Business Cycle Fluctuations,” American Economic Review, 102, 1692–1720.
Greenwald, B.C. and Stiglitz, J.E., 1990. “Asymmetric Information and the New Theory of the Firm: Financial Constraints and Risk Behavior,” (No. w3359). National Bureau of Economic Research.
Gulen, H. and Ion, M., 2015. “Policy Uncertainty and Corporate Investment,” The Review of Financial Studies, 29, 523–564.
Kaplan, S. and Zingales, L., 1997. “Do Financing Constraints Explain why Investment is Correlated with Cash Flow?” Quarterly Journal of Economics, 112, 169-215.
Rogers, J, Sun, B., and Webster, C., 2021. “U.S.-China Tensions,” working paper. www.JohnRogerseconomist.net.

Latest
Most Popular
- VoxChina Covid-19 Forum (Second Edition): China’s Post-Lockdown Economic Recovery VoxChina, Apr 18, 2020
- China’s Great Housing Boom Kaiji Chen, Yi Wen, Oct 11, 2017
- China’s Joint Venture Policy and the International Transfer of Technology Kun Jiang, Wolfgang Keller, Larry D. Qiu, William Ridley, Feb 06, 2019
- The Dark Side of the Chinese Fiscal Stimulus: Evidence from Local Government Debt Yi Huang, Marco Pagano, Ugo Panizza, Jun 28, 2017
- Wealth Redistribution in the Chinese Stock Market: the Role of Bubbles and Crashes Li An, Jiangze Bian, Dong Lou, Donghui Shi, Jul 01, 2020
- What Is Special about China’s Housing Boom? Edward L. Glaeser, Wei Huang, Yueran Ma, Andrei Shleifer, Jun 20, 2017
- Privatization and Productivity in China Yuyu Chen, Mitsuru Igami, Masayuki Sawada, Mo Xiao, Jan 31, 2018
- Evaluating Risk across Chinese Housing Markets Yongheng Deng, Joseph Gyourko, Jing Wu, Aug 02, 2017
- How did China Move Up the Global Value Chains? Hiau Looi Kee, Heiwai Tang, Aug 30, 2017
- China’s Shadow Banking Sector: Wealth Management Products and Issuing Banks Viral V. Acharya, Jun Qian, Zhishu Yang, Aug 09, 2017


