A Bridge on Economic Issues between China and the World


 Facebook
  Twitter
  Instagram
 WeChat
  Email
Email Ownership and Productivity in Vertically Integrated Firms in China

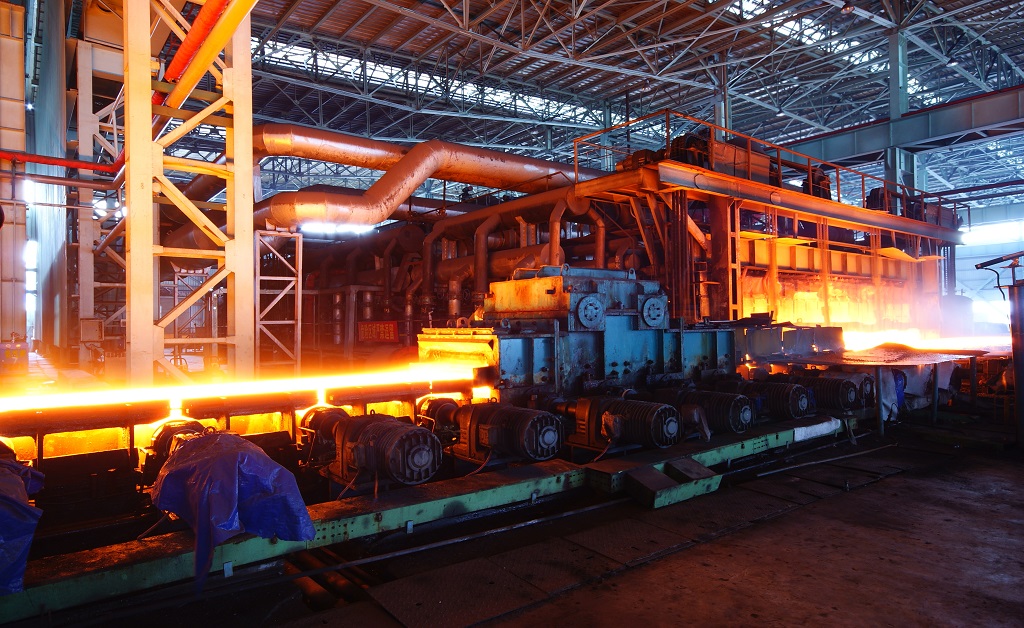
This paper studies differences in the internal configuration and productivity in vertically integrated steel facilities in China using equipment-level information on inputs and output for each of the main stages in the value chain. At the facility level, we do not find statistically significant differences in productivity by ownership. This conceals important differences in the value chain: private firms outperform in pig iron and steel making but lag upstream in sintering. Inferior access to higher-quality imported raw materials and the use of less automated technology is a likely source of these differences.
Increases in productivity are an important source of economic growth for firms, industries, and countries. Researchers have documented sizable and persistent productivity differences between producers and identified their elimination as a potentially important source of productivity growth (Syverson 2004, Hsieh and Klenow 2009). Issues of endogeneity and measurement error often hinder obtaining accurate measures of productivity (De Loecker and Goldberg 2014). Productivity is also usually carried out at the aggregate firm level; in contrast, production activity of firms often involves vertically integrated operations carried out in multiple production units in which technologies and productivity likely differ by stage of production. Aggregate data miss this dimension and may result in biased estimates of the underlying production technology and firm-level productivity. This may have important policy implications.
In the context of China’s vertically integrated steel producers, this paper (Brandt, Jiang, Luo, and Su 2020) investigates the sources of productivity differences between production facilities through the lens of their internal structure. To our knowledge, this paper is one of the first to investigate these kinds of links. By fact of its size—the sector produces half of the world’s steel—China’s steel industry is important both domestically and internationally. The sector also remains heavily state-dominated. Recent literature documents sizable productivity differences between firms and sectors in China that appear tied to ownership and the regulatory environment (Berkowitz, Ma, and Nishioka 2017). State-owned enterprises (SOEs) often enjoy better access to capital, technology, inputs, and human resources, but are also tasked with non-economic objectives and typically operate under softer-budget constraints.
We draw on unique monthly data for the period between 2009 and 2011 collected by the China Iron and Steel Association (CISA) to examine differences in the internal configuration and productivity of steel facilities in China. Detailed input and output data at the equipment level allow us to obtain production function estimates for the three main stages in steel’s value chain (sintering, pig iron making, and steel making) as part of a multistage production system. In vertically integrated steel facilities, the output in each production stage serves as the key material input for the subsequent downstream stage. Following Domar (1961), we then integrate our productivity estimates for each stage into estimates for integrated facilities, using as weights the estimated elasticities of material inputs in pig iron making and steel making. Intuitively, the facility-level productivity reflects the sum of productivity in each stage weighted by its importance in the production chain using elasticities. The richness of our data allows us to measure the efficiency of producers at the integrated facility level, and more importantly, to decompose differences in performance by ownership type into process (stage) level differences.
Internal Configuration and Size
A firm’s choice with respect to the internal configuration of its operation reflects both demand and supply side factors. Increasing returns to scale in equipment size provide incentives to achieve the desired capacity using larger equipment. As they try to expand however, some firms may face more severe constraints compared to others in the form of access to high-quality raw materials, human capital, and finance. Demand-side considerations and profitability work in the opposite direction. In the face of demand shocks, it is costly for firms to shut down (or start up) furnaces, costs that increase with the size of the equipment. This makes it more difficult for firms with larger machinese and furnaces to adjust to changes in demand in the short run.
Our data reveal systematic differences in the size and internal configuration of steel making facilities by ownership. Central SOEs operate the largest facilities, which on average are more than twice as large as those of private firms, and a third larger than the facilities of provincial SOEs (see Table 1). These differences are accompanied by systematic differences in the number and size of the equipment used by firms as the size of an integrated facility increases (see Table 2). Central SOEs consistently operate the smallest number of machines/furnaces in each size category, followed by provincial state-owned and then private facilities. Alternatively, as SOEs build larger integrated facilities, they do so using machines/furnaces of larger average size compared to private firms.
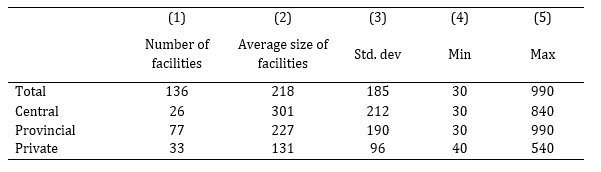
Notes: The size of a sintering machine is measured by its effective areas in m2; the size of a blast furnace is measured by its effective volume in m3; the size of a basic oxygen furnace is measured by its tonnage. Facility size is measured by the total size of basic oxygen furnaces (steel making) within the facility.
Table 2: Internal Configuration of Integrated Facilities by Size
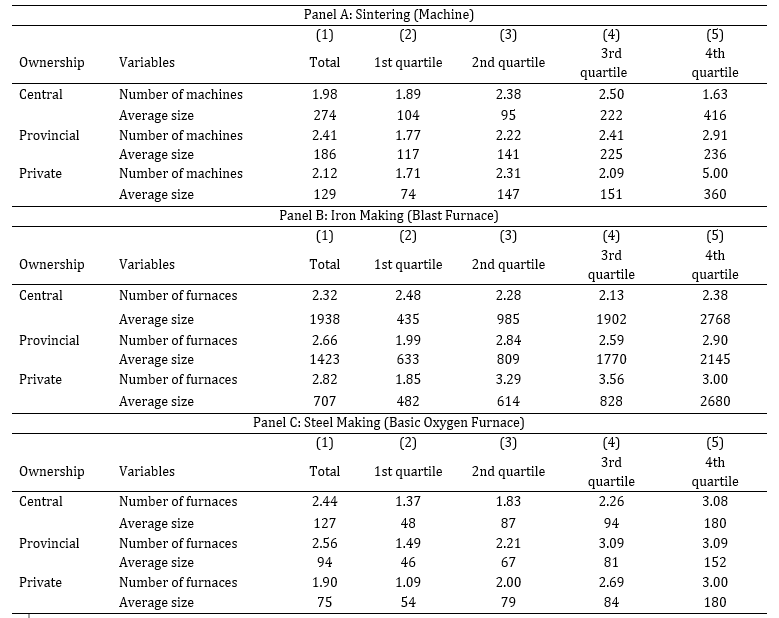
Notes: Facility size is measured by the total size of basic oxygen furnaces (steel making) within the facility. The size quartiles are calculated over the facility-month observations in the whole sample and are defined as follows: <90, [90,160), [160,300) and ≥300. The size of a sintering machine is measured by its effective areas in m2; the size of a blast furnace is measured by its effective volume in m3; the size of a basic oxygen furnace is measured by its tonnage.
Production Function Estimates
We obtain production function estimates for the three main stages in steel’s value chain (sintering, pig iron making, and steel making) as part of a multistage production system. Our Generalized Method of Moment (GMM) estimates imply increasing returns to scale in each stage of production, with the returns for sintering (1.07) and pig iron (1.07) similar to those in steel making (1.06). These estimates imply even larger increasing returns to scale of 1.14 at the facility level. Firms clearly have incentives to use larger machines and furnaces and to produce in larger facilities.
Productivity Differences by Ownership
We present estimates of facility-level productivity differentials by ownership (see Table 3). Estimates are obtained from simple Ordinary Least Squares (OLS) regressions of the log of facility-level Total Factor Productivity (TFP) on ownership dummies that control for the effect of seasonality with the use of monthly dummies. In these regressions, facilities of central SOEs are our omitted category. At the facility level, we do not find statistically significant differences in productivity by ownership. Column (1) shows that private integrated facilities are, on average, 7.4% more productive than the facilities in central SOEs, and are 1.1% more productive relative to provincial SOEs, however, neither of these estimates is statistically significant.
Our unique data allow us to examine more carefully productivity differences at the facility level by analyzing similar differences by stage of production. In columns (2), (3) and (4), we report estimates of productivity by ownership for each stage of production. In both pig iron making and steel-making, private facilities have a statistically significant productivity advantage over central SOEs of 6.1% and 6.2%, respectively, and a slightly smaller advantage in comparison with provincial SOEs. In sharp contrast, the productivity ordering by ownership is reversed for sintering: sintering machines of central SOEs are 10.8% more productive than private facilities, and 9.3% more productive than provincial SOEs (see Note 1). The lack of a clear ordering of productivity by ownership at the facility level is a product of these opposing forces.
Table 3: Productivity Differences by Ownership
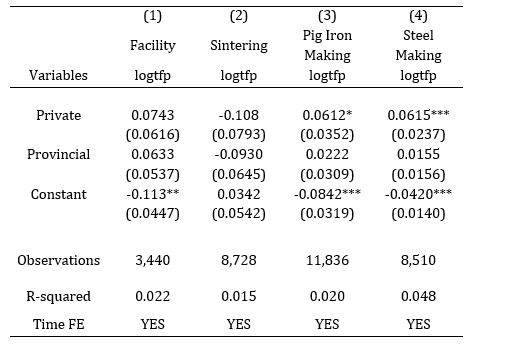
Notes: Central state-owned enterprises and their machines/furnaces are the omitted group. Private and provincial indicate ownership dummies.The size of a sintering machine is measured by its effective areas in m2; the size of a blast furnace is measured by its effective volume in m3; the size of a basic oxygen furnace is measured by its tonnage. Facility size is measured by the total size of basic oxygen furnaces (steel making) within the facility. Standard errors are clustered by machines/furnaces for stage-level analysis and by facility for facility-level analysis, but not corrected for the sampling error in constructed productivity.
Explaining the Differences
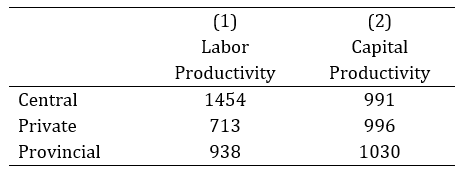
What might help explain the reversal in productivity by ownership in the case of sintering? A simple comparison of labor and capital productivity in sintering reported in Table 4 suggests only modest differences between private firms and central SOEs in output per unit of capacity, however, labor productivity in private firms is only one-half of that in central SOEs. This implies that private firms use two times as much labor per unit of output as central SOEs. Two related factors are important here. First, despite the use of similar technology in the major process of sintering, industry reports suggest firms differ in the choice of equipment in auxiliary processes, for example, mixture of raw materials, with SOEs using more automated processes by comparison to the labor-intensive methods adopted by small- and medium-sized private firms (Wang and Lin 2014). Second, there are differences by ownership in access to high-quality iron ore, which matters for equipment choice for the sub-processes, labor use, and processing time. Automated equipment is more demanding in terms of the quality and uniformity of the raw materials used. Underlying this is access to imports (see Note 2).
Table 4: Labor and Capital Productivity in Sintering
China is highly dependent on imported iron ore. Over the three-year period between 2009 and 2011, imports were the source of 70% of the iron ore used by the sector (Tao 2019). The quality of imported iron ore is also higher than the ore mined domestically. Significant differences in access to imported iron ore exist between SOEs and private firms. Central here are changes that were made in the import licensing system for iron ore in 2005 that restricted the right to import directly from foreign countries to larger privileged firms (in der Heiden 2011). As a result, the number of firms importing iron ore fell sharply from over 500 to 112, of which 70 were steel makers (Zhang 2010). Conservatively, private steel firms used two-thirds more domestic iron ore than did SOEs.
Implications
Much is potentially missed in the analysis based on aggregate firm-level data. In addition to biases in the estimation of the underlying production technology and firm-level productivity, analysis at the aggregate level can conceal important differences throughout the value chain, as well as the sources of these differences. In the context of China’s vertically integrated steel industry, our research suggests that relaxing constraints facing private sector firms in access to higher-quality imported iron ore would likely eliminate productivity differences vis-à-vis SOEs in sintering and, at the facility level, reinforce the productivity premium they already enjoy in pig iron and steel production.
Firms’ choices as to how to configure their production are influenced by dynamic considerations. Increasing returns to scale of the magnitude that we find encourage the production of steel in larger facilities using larger equipment and furnaces in each stage. But there are also likely advantages of smaller size in the form of lower adjustment costs to shocks in market demand. Ongoing efforts to consolidate production in China’s steel sector in a smaller number of larger facilities (typically state-owned) may have significant costs. To examine the trade-offs, we need to build and estimate a structural dynamic model that looks at the role of both demand and supply side considerations in firms’ choices. Access to several more years of firm level data will facilitate model identification by providing information that spans both booms and busts in China’s steel market.
Note 1: In sintering, these differences are not statistically significant in regressions that include only ownership, but they are significant when equipment size is included.
Note 2: Differences in the quality of sinter—the output from sintering and the main material input into pig iron production—are relatively small between state and non-state firms. The same is true for the quality of pig iron that goes into steel production. In short, the problem of material input quality primarily affects the most upstream stage in the production of steel.
(Loren Brandt is the Noranda Chair Professor of Economics and International Trade at the University of Toronto; Feitao Jiang is the Deputy Director and Associate Researcher at the Institute of Industrial Economics, Chinese Academy of Social Sciences; Yao Luo is an Assistant Professor of Economics at the University of Toronto; Yingjun Su is an assistant professor of economics at the Institute for Economic and Social Research of Jinan University.)
References
Berkowitz, Daniel, Hong Ma, and Shuichiro Nishioka. 2017. “Recasting the Iron Rice Bowl: The Reform of China’s State-Owned Enterprises.” Review of Economics and Statistics 99, no. 4 (October): 735–47. https://doi.org/10.1162/REST_a_00637.
Brandt, Loren, Feitao Jiang, Yao Luo, and Yingjun Su. 2020. “Ownership and Productivity in Vertically Integrated Firms: Evidence from the Chinese Steel Industry.” Review of Economics and Statistics, posted online May 6, 2020. https://doi.org/10.1162/rest_a_00923.De Loecker, Jan, and Pinelopi Koujianou Goldberg. 2014. “Firm Performance in a Global Market.” Annual Review of Economics 6: 201–27. https://doi.org/10.1146/annurev-economics-080113-104741.
Domar, Evsey D. 1961. “On the Measurement of Technological Change.” Economic Journal 71, no. 284 (December): 709–29. https://doi.org/10.2307/2228246.
Hsieh, Chang-Tai, and Peter J. Klenow. 2009. “Misallocation and Manufacturing TFP in China and India.” Quarterly Journal of Economics 124, no. 4 (November): 1403–48. https://doi.org/10.1162/qjec.2009.124.4.1403.
in der Heiden, Peter Thomas. 2011. “Chinese Sectoral Industrial Policy Shaping International Trade and Investment Patterns: Evidence from the Iron and Steel Industry.” Institute of East Asian Studies Working Paper No. 88. https://www.uni-due.de/imperia/md/content/in-east/about/publications_green_series/paper88.pdf.
Syverson, Chad. 2004. “Product Substitutability and Productivity Dispersion.” Review of Economics and Statistics 86, no. 2 (May): 534–50. https://doi.org/10.1162/003465304323031094.
Tao, Hanyi. 2019. “Targeted Subsidy and Capital (Mis)allocation.” China International Conference in Macroeconomics Working Paper. http://cicm.pbcsf.tsinghua.edu.cn/Public/Uploads/upload/CICM2019-114.pdf
Wang, Dubin, and Wanming Lin. 2014. Overview of Iron and Steel Metallurgy. Beijing: Chemical Industry Press.
Zhang, Yi. 2010. “The Number of Approved Iron Ore Importing Enterprises Is Going to be Reduced.” New Beijing Newspaper, August 4, 2010. http://stock.hexun.com/2010-08-04/124470560.html.

Latest
Most Popular
- VoxChina Covid-19 Forum (Second Edition): China’s Post-Lockdown Economic Recovery VoxChina, Apr 18, 2020
- China’s Joint Venture Policy and the International Transfer of Technology Kun Jiang, Wolfgang Keller, Larry D. Qiu, William Ridley, Feb 06, 2019
- China’s Great Housing Boom Kaiji Chen, Yi Wen, Oct 11, 2017
- Wealth Redistribution in the Chinese Stock Market: the Role of Bubbles and Crashes Li An, Jiangze Bian, Dong Lou, Donghui Shi, Jul 01, 2020
- The Dark Side of the Chinese Fiscal Stimulus: Evidence from Local Government Debt Yi Huang, Marco Pagano, Ugo Panizza, Jun 28, 2017
- What Is Special about China’s Housing Boom? Edward L. Glaeser, Wei Huang, Yueran Ma, Andrei Shleifer, Jun 20, 2017
- Privatization and Productivity in China Yuyu Chen, Mitsuru Igami, Masayuki Sawada, Mo Xiao, Jan 31, 2018
- Evaluating Risk across Chinese Housing Markets Yongheng Deng, Joseph Gyourko, Jing Wu, Aug 02, 2017
- How did China Move Up the Global Value Chains? Hiau Looi Kee, Heiwai Tang, Aug 30, 2017
- China’s Shadow Banking Sector: Wealth Management Products and Issuing Banks Viral V. Acharya, Jun Qian, Zhishu Yang, Aug 09, 2017


