A Bridge on Economic Issues between China and the World


 Facebook
  Twitter
  Instagram
 WeChat
  Email
Email From Fog to Smog: The Value of Pollution Information

During 2013–2014, China launched a nation-wide real-time air quality monitoring and disclosure program, which was a watershed moment in the history of its environmental regulations. We present the first empirical analysis of this natural experiment by exploiting its staggered introduction across cities. The program substantially expanded public access to pollution information, and in turn, triggered a cascade of behavioral changes in household activities such as online searches, day-to-day shopping, and housing demand when pollution was elevated. A conservative estimate of the annual health benefit is RMB 130 billion, which is at least one order of magnitude larger than the cost of the program and the associated avoidance behavior. Our findings highlight that developing countries, many of which have some of the world’s worst air pollution but do not systematically collect or disseminate pollution information, could benefit considerably from improving access to pollution information.
Although air pollution has been a longstanding issue in China, public access to real-time daily pollution measures was practically absent prior to 2013. The Ministry of Environmental Protection (MEP) has published the daily Air Pollution Index (API) for major cities since 2000, but the index, which was reported only after the fact, only partially reflected true air quality because it did not incorporate PM2.5, the major air pollutant in many Chinese cities. The lack of awareness of PM2.5 led to a widespread “fog-smog” confusion among the public, where poor visibility due to high levels of PM2.5 was often characterized as fog rather than smog by both government agencies and the media.
The real-time PM2.5 monitoring and disclosure program started in December 2012 was a watershed moment in the history of China’s environmental regulations. The program brought about a sharp and sudden change in the ability to access pollution information for average residents and drastically enhanced public awareness of the health impacts of PM2.5.
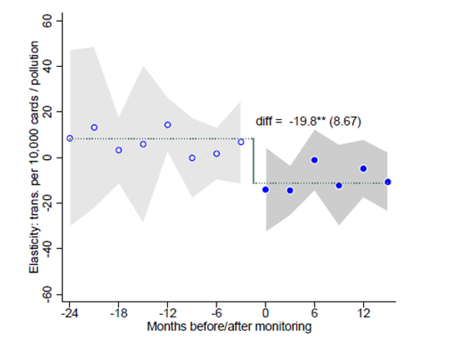
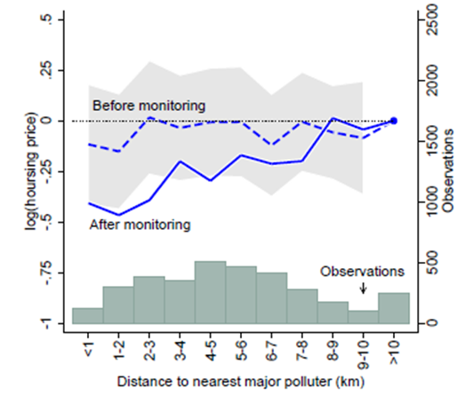
Our recent study, Barwick, Li, Lin, and Zou (2019), documents the profound impact of this information program by exploiting the most comprehensive database ever complied on a rich set of outcomes including social awareness, air quality measures from satellites, short- and long-run economic activities, and health outcomes that cover the period before and after the information program. Our research design exploits the staggered introduction of the information program across three waves of cities over the course of two years. The program began in 74 major cities that represent the country’s key population and economic centers (such as the Beijing-Tianjin-Hebei Metropolitan Region and provincial capitals). Real-time readings on all major air pollutants were posted online and were ready for streaming by December 31, 2012. By October 31, 2013, the second wave was completed, adding 116 cities from the list of the 2007 Environmental Improvement Priority Cities and the National Environmental Protection Exemplary Cities, many of which are neighbors to cities in the first wave. In the final wave, completed on November 20, 2014, the program reached the remaining 177 cities. The staggered roll-out allows us to implement an event-study design. This research method estimates the causal effect of the information program through the identification of sharp changes in outcomes that occur exactly at the time of roll-out. As important checks for research design validity, we assess the parallel trends property through the visualization of trends in outcomes before the program roll-out; we find flat and stable pre-trends, as shown in the figures below.
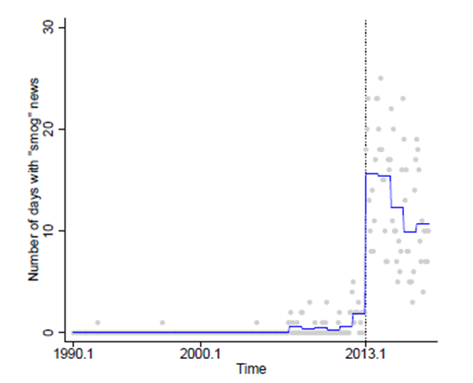
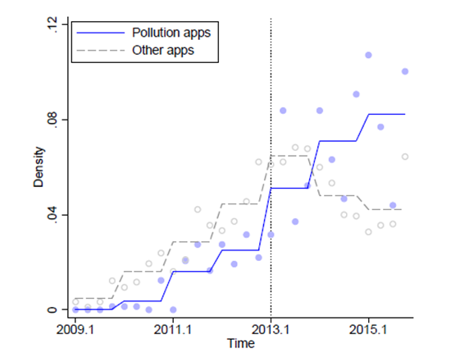
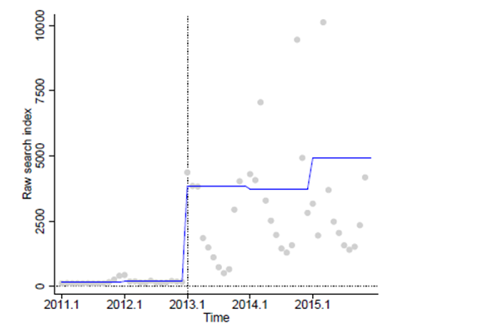
We first show that the information program has transformed the landscape of public access to pollution information and dramatically increased households’ awareness about pollution issues. The frequency of air-pollution related articles in People’s Daily, the government’s official newspaper, rises from less than once per week to almost daily (Figure 1). The number of mobile phone applications (“apps”) released each year that stream air pollution data to users surges by 500%, four times faster than the growth of other apps (Figure 2). Immediately after the program was launched, the term “smog” (“wu mai” in Chinese) has become, for the first time, a buzzword in social media (Figure 3).
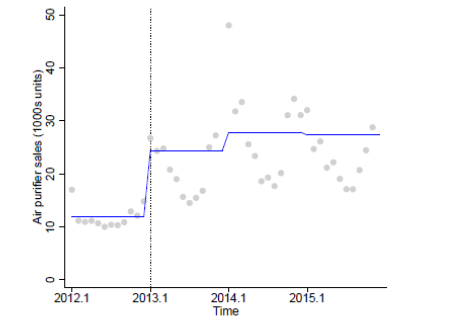
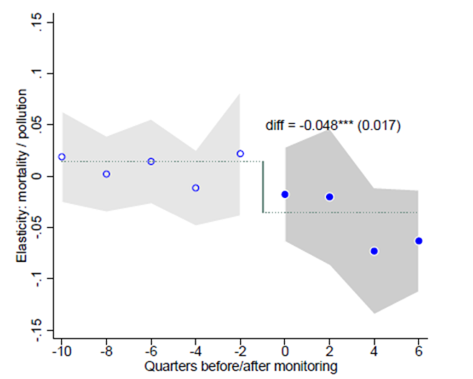
Combining our findings with existing estimates on the causal effect of pollution on mortality in China (e.g., Ebenstein et al., 2017), we find that access to pollution information has reduced premature deaths attributable to air pollution exposure by nearly 7% and has generated a health benefit that is equivalent to a 10 ug/m3 reduction in PM10. Based on recent estimates in the literature (Ito and Zhang, 2018; Ashenfelter and Greenstone, 2004; Murphy and Topel, 2006), the associated annual benefits vary from RMB 130 billion (using willingness-to-pay for clean air) to RMB 520 billion (using age-adjusted value of statistical life). By our calculations, such social benefits outweigh the costs of defensive investments (such as air purifier purchases), avoidance behavior (such as forgone consumption), and deploying and maintaining the program by at least one order of magnitude, making the information program among the most successful environmental policies in a developing country.
China’s experience offers an important lesson for other developing countries that are experiencing severe environmental challenges. The infrastructure for monitoring environmental quality and disclosing information is often inadequate in those countries. As income rises, the demand for environmental quality increases and households are better able to adapt to the changing environment. Improving information access can be low-hanging fruit in the ongoing battle with environmental challenges. Providing real-time pollution monitoring data, combined with effective dissemination infrastructure such as smartphones and the internet that are now commonly available among developing countries, could prove to be a powerful tool to help households mitigate health damages from environmental pollution and to enhance the effectiveness of other environmental regulations.
References:
Ashenfelter, Orley, and Michael Greenstone. 2004. “Estimating the Value of a Statistical Life: The Importance of Omitted Variables and Publication Bias.” American Economic Review, 94(2): 454-460.
Barwick, Panle Jia, Shanjun Li, Liguo Lin, and Eric Zou (2019), “From Fog to Smog: The Value of Pollution Information,” NBER working paper, No. 26541.
Currie, Janet, Lucas Davis, Michael Greenstone, and Reed Walker. 2015. “Environmental Health Risks and Housing Values: Evidence from 1,600 Toxic Plant Openings and Closings.” American Economic Review, 105(2): 678–709.
Ebenstein, Avraham, Maoyong Fan, Michael Greenstone, Guojun He, and Maigeng Zhou. 2017. “New Evidence on the Impact of Sustained Exposure to Air Pollution on Life Expectancy from China’s Huai River Policy.” Proceedings of the National Academy of Sciences, 114: 10384–10389.
Ito, Koichiro, and Shuang Zhang. 2018. “Willingness to Pay for Clean Air: Evidence from Air Purifier Markets in China.” Journal of Political Economy. forthcoming.
Murphy, Kevin M., and Robert H. Topel. 2006. “The Value of Health and Longevity.” Journal of Political Economy, 114(5): 871–904.

Latest
Most Popular
- VoxChina Covid-19 Forum (Second Edition): China’s Post-Lockdown Economic Recovery VoxChina, Apr 18, 2020
- China’s Joint Venture Policy and the International Transfer of Technology Kun Jiang, Wolfgang Keller, Larry D. Qiu, William Ridley, Feb 06, 2019
- China’s Great Housing Boom Kaiji Chen, Yi Wen, Oct 11, 2017
- Wealth Redistribution in the Chinese Stock Market: the Role of Bubbles and Crashes Li An, Jiangze Bian, Dong Lou, Donghui Shi, Jul 01, 2020
- The Dark Side of the Chinese Fiscal Stimulus: Evidence from Local Government Debt Yi Huang, Marco Pagano, Ugo Panizza, Jun 28, 2017
- What Is Special about China’s Housing Boom? Edward L. Glaeser, Wei Huang, Yueran Ma, Andrei Shleifer, Jun 20, 2017
- Privatization and Productivity in China Yuyu Chen, Mitsuru Igami, Masayuki Sawada, Mo Xiao, Jan 31, 2018
- How did China Move Up the Global Value Chains? Hiau Looi Kee, Heiwai Tang, Aug 30, 2017
- Evaluating Risk across Chinese Housing Markets Yongheng Deng, Joseph Gyourko, Jing Wu, Aug 02, 2017
- China’s Shadow Banking Sector: Wealth Management Products and Issuing Banks Viral V. Acharya, Jun Qian, Zhishu Yang, Aug 09, 2017


